← A Level Economics Revision · Home

The loanable funds diagram (crowding out) — A-Level Economics
Play the game and get tested on every point of the diagram — every wrong answer gets a diagnosis. Then study the answers below. Measure what you don’t know, then fix what you don’t know.
The diagram
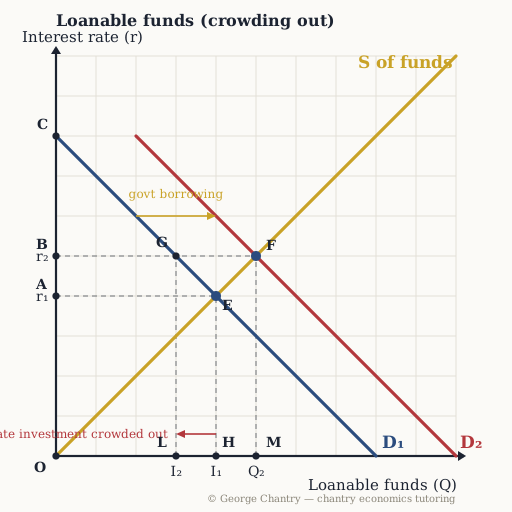
The interest rate is simply the price in a market for loans: savers supply the funds, borrowers demand them. Government borrowing adds a colossal extra customer, so demand shifts right from D₁ to D₂ and the equilibrium moves from E (r₁, I₁) to F (r₂, total lending Q₂). Read private demand along the ORIGINAL curve D₁ at the new rate r₂ and you land on G: private investment has fallen from I₁ to I₂. Total lending is up; the private share is down.
The game’s questions — with the answers explained on the diagram
These are the exact questions the game asks. Play first if you want the real test — or study them here with the answer for each one.
1. What shifts the demand for loanable funds right from D₁ to D₂?
The government borrowing heavily to fund a budget deficit. Savers are the suppliers in this market and borrowers are the demanders, so households saving more would shift SUPPLY. A change in the interest rate itself is the price, so it only moves you along a curve. During Covid the government borrowed £400 billion, around 20% of the economy: a huge customer turning up and wanting an enormous quantity puts demand pressure on the price.
2. Government borrowing shifts demand from D₁ to D₂. Which point is the new equilibrium?
Point F. Equilibrium is where the supply of funds crosses the NEW demand curve. Total lending rises from 4 to 5 and the rate rises from r₁ to r₂. Point G matters too, but it answers a different question — how much of that lending is still going to private firms.
3. Which point on the interest-rate axis shows the higher interest rate?
Point B, r₂. Read across from the new equilibrium F to the rate axis. Point A is r₁, the rate before the government started borrowing. That rise from A to B is the entire cost of crowding out — everything else follows from it.
4. Complete the crowding-out chain: government borrowing → interest rate rises → …?
Borrowing becomes more expensive for firms, so private investment falls, the capital stock grows more slowly and long-run productive potential is lower. With a finite supply of savings, the government and the private sector compete for the same pool of loanable funds. Government borrowing raises demand for those funds → the equilibrium interest rate is pushed up → financing investment costs firms more → private I falls → the capital stock grows more slowly → long-run productive potential is lower than it would have been. The short-run AD gain comes at a long-run supply-side cost. Concretely: the business that wanted to borrow £50k now pays 10% interest, not 5%, so the project no longer stacks up.
5. Which distance shows the private investment that has been crowded out?
The distance L to H. Find private investment on the ORIGINAL private demand curve D₁ at the new rate r₂: that is point G, giving quantity I₂ (point L on the axis). Before the government arrived it was I₁ (point H). The horizontal distance L to H is the private investment squeezed out. Note both facts are true at once: total lending went UP from 4 to 5, while the private share went DOWN from 4 to 3. Saying both is what earns the mark. The distance H to M is the extra lending the government took on, and A to B is a price distance, not a quantity.
6. Evaluation: when does government spending crowd IN private investment instead?
In a demand recession with high spare capacity. The Keynesian counter: public spending lifts demand and improves the infrastructure firms operate on, raising private-sector profitability and expectations. Infrastructure in particular complements private activity — lower logistics costs, new commercial opportunities — and firms find demand for their goods has risen, so the expected return on investment improves. Private I rises rather than falls. Weak evaluation says “it depends”; strong evaluation says what it depends on and resolves it. Here the hinge is spare capacity: in a recession, crowding out is at its weakest.
Now test yourself
Every point on this diagram has a letter. Answer with the points and the distances, exactly like the exam. Every wrong answer gets a diagnosis — that is the diagram telling you what to fix.