← A Level Economics Revision · All Loanable funds (crowding out) questions · Home
A-Level Economics · Loanable funds (crowding out) diagram question
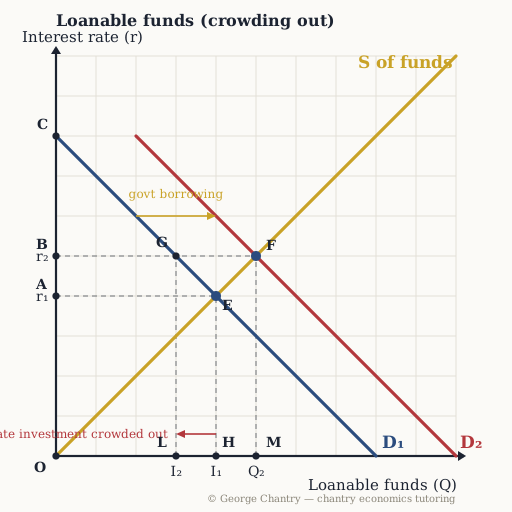
Which point on the interest-rate axis shows the HIGHER interest rate the government's borrowing produces?
The diagram
The answer
Point B. Read across from F: the rate rises from r₁ (A) to r₂ (B). That rise is the entire cost of crowding out. Read across from the new equilibrium F to the interest-rate axis: point B, r₂. A huge customer turning up and wanting an enormous quantity puts demand pressure on the price, and in this market the price is the interest rate.
Test yourself properly
This is one of 6 questions on the loanable funds (crowding out) diagram — every corner lettered, every wrong answer diagnosed.
▶ Play the loanable funds (crowding out) game All questions & answers

George Chantry
Professional A-Level Economics tutor · Oxford PPE First, 3 prizes in economics · 7,000+ hours one-to-one