← A Level Economics Revision · All Loanable funds (crowding out) questions · Home
A-Level Economics · Loanable funds (crowding out) diagram question
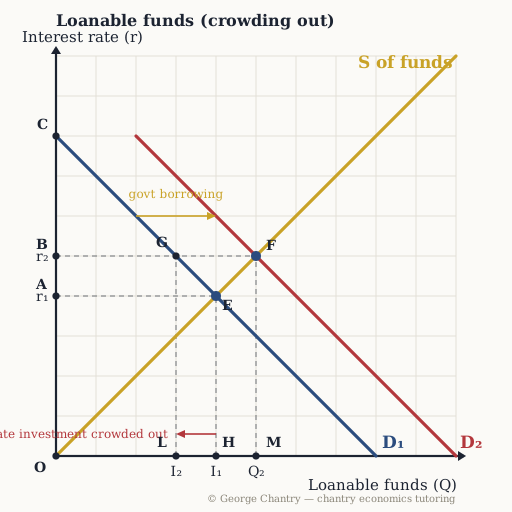
What shifts the DEMAND for loanable funds right from D₁ to D₂?
The diagram
The answer
The government borrowing heavily to fund a budget deficit. The government is a borrower like any other — a huge one. During Covid it borrowed £400 billion, around 20% of the economy. The interest rate is just the price in a market for loans: savers supply the funds, borrowers demand them. When the government borrows to fund a deficit, a colossal extra customer turns up wanting funds, so DEMAND shifts right from D₁ to D₂. A change in the interest rate itself would only move you along a curve.
Test yourself properly
This is one of 6 questions on the loanable funds (crowding out) diagram — every corner lettered, every wrong answer diagnosed.
▶ Play the loanable funds (crowding out) game All questions & answers

George Chantry
Professional A-Level Economics tutor · Oxford PPE First, 3 prizes in economics · 7,000+ hours one-to-one