← A Level Economics Revision · Home

The SRAS shift left (cost-push inflation) diagram — A-Level Economics
Play the game and get tested on every point of the diagram — every wrong answer gets a diagnosis. Then study the answers below. Measure what you don’t know, then fix what you don’t know.
The diagram
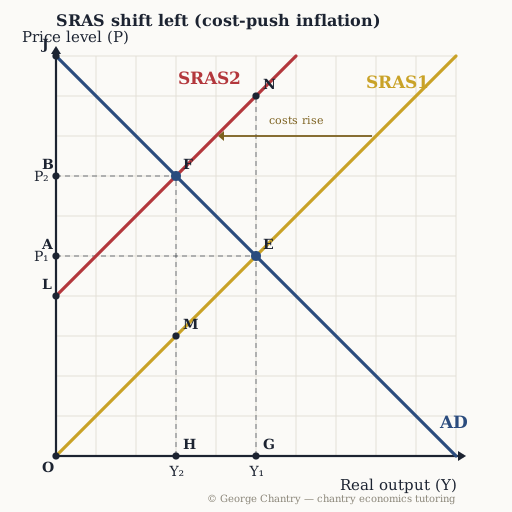
A cost shock — energy, raw materials, wages — shifts SRAS1 left to SRAS2. The economy moves along AD from E to F: the price level rises from P₁ to P₂ while real output falls from Y₁ to Y₂. That is stagflation, two macro objectives missed at once. The vertical gap M F is the size of the cost rise (4); the price level only rose by 2, because the economy also moved back along AD.
The game’s questions — with the answers explained on the diagram
These are the exact questions the game asks. Play first if you want the real test — or study them here with the answer for each one.
1. Which of these shifts SRAS to the left?
A sharp rise in energy and raw-material prices, raising every firm’s costs of production. SRAS is a cost curve, so ask one question of every candidate: does it change what it costs firms to produce? Falling petrol, gas, electricity and food prices shift SRAS right; rising ones shift it left. Confidence and tax cuts change spending, so they move AD instead.
2. Costs rise and SRAS1 shifts to SRAS2. Which point is the new equilibrium?
F — where AD crosses SRAS2, at price level P₂ and real output Y₂. After a cost shock the economy moves along AD to the new crossing. Reading straight up from the old output (to N) is the classic slip: firms do not keep producing Y₁ once costs have risen.
3. Why is this outcome called stagflation — the double hit?
The price level rises and real output falls at the same time. A leftward SRAS shift raises prices while reducing real GDP. Demand-side policy then faces an impossible choice: tighten and deepen the recession, or loosen and add to the inflation. Say both effects explicitly on the diagram and you have the whole answer.
4. The wage-price spiral: how does it feed cost-push inflation?
Workers demand higher wages to compensate for falling purchasing power; firms accept, costs rise, and firms pass those costs on as higher prices. Once inflation is anticipated the loop becomes self-fulfilling and very hard to break. Rational consumers also bring spending forward to lock in today’s prices, adding demand-pull pressure on top of the cost-push.
5. Which distance measures the rise in costs that shifted the curve — the vertical gap between SRAS1 and SRAS2?
M F — measured vertically at Y₂, from SRAS1 up to SRAS2: a cost rise of 4. The price level, read off the axis, only rose from 5 to 7, because as prices rise the economy moves back along AD and output falls. Cost rise and price rise are different numbers, and the exam rewards knowing which is which.
6. Evaluation: why is cost-push inflation usually judged worse than demand-pull?
Cost-push arrives alongside a recession; demand-pull arrives alongside growth. Demand-pull can even be read as a sign of healthy consumer optimism, and moderate demand-pull around the 2% target is actively good for economic growth. Diagnose which one you are looking at first — the two need very different treatment.
Now test yourself
Every corner has a letter. Answer with the points and areas, exactly like the exam. Every wrong answer gets a diagnosis — that is the diagram telling you what to fix.