← A Level Economics Revision · All SRAS shift left (cost-push inflation) questions · Home
A-Level Economics · SRAS shift left (cost-push inflation) diagram question
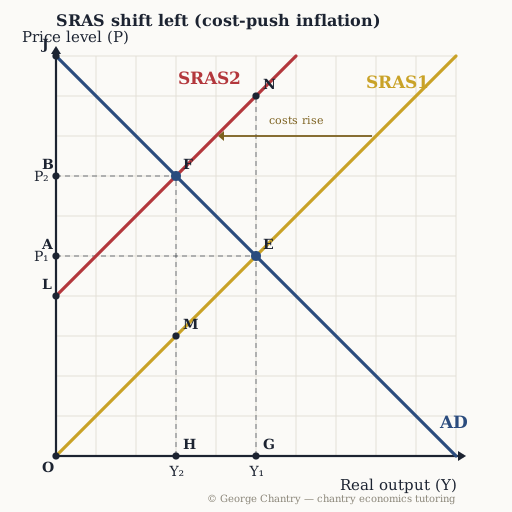
Why is this outcome called STAGFLATION — the double hit?
The diagram
The answer
The price level rises from P₁ to P₂ AND real output falls from Y₁ to Y₂ at the same time. Inflation AND recession in one shock. Two macro objectives missed at once — that is why cost-push is so hard for a government to answer. A leftward SRAS shift raises the price level while REDUCING real GDP — the textbook stagflation outcome. Demand-side policy then faces an impossible choice: tighten and deepen the recession, or loosen and add to the inflation. Say both effects explicitly on the diagram and you have the whole answer.
Test yourself properly
This is one of 6 questions on the sras shift left (cost-push inflation) diagram — every corner lettered, every wrong answer diagnosed.
▶ Play the sras shift left (cost-push inflation) game All questions & answers

George Chantry
Professional A-Level Economics tutor · Oxford PPE First, 3 prizes in economics · 7,000+ hours one-to-one