← A Level Economics Revision · Home

The Keynesian LRAS diagram (spare capacity) — A-Level Economics
Play the game and get tested on every point of the diagram — every wrong answer gets a diagnosis. Then study the answers below. Measure what you don’t know, then fix what you don’t know.
The diagram
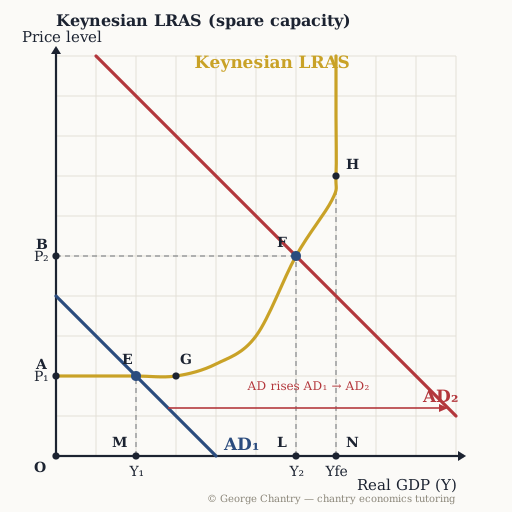
The Keynesian LRAS is shaped by spare capacity. It is horizontal at low output (idle labour and capital, so extra demand becomes real output with no inflation), curves upward as the economy approaches capacity, and turns vertical at full employment — point H at Yfe, where Keynesians and Classicals agree. AD₁ crosses the flat range at E (a deep recession); AD₂ crosses the steep range at F, where the same stimulus buys mostly inflation.
The game’s questions — with the answers explained on the diagram
These are the exact questions the game asks. Play first if you want the real test — or study them here with the answer for each one.
1. The economy is in a deep recession, so AD₁ crosses the Keynesian LRAS on its flat range. Which point is that equilibrium?
Point E. Equilibrium is the crossing of AD with the AS curve: AD₁ meets the horizontal section at E — output only 2, price level 2. That flat section is what a Great Depression, 2008 or Covid-style demand collapse looks like on a diagram: huge spare capacity. Point G is the end of the flat range, not a crossing.
2. AD rises while the economy is on the FLAT range. What happens?
Real output rises with no rise in the price level, because idle labour and capital are brought back into use. On the flat range there is large spare capacity. Firms meet the extra demand by putting idle workers and idle capital back to work rather than by competing for scarce ones, so wages and factor prices are not bid up. Real GDP rises with no demand-pull inflation. This is why Keynesians say fiscal stimulus in a recession has no inflationary side effect — and the multiplier makes the growth gain bigger still, because one person’s expenditure is someone else’s income.
3. Which point shows full-employment output, where the Keynesian LRAS becomes vertical?
Point H, at Yfe. Full employment is where the curve turns vertical. Every factor of production is in use, so we cannot produce any more — to produce beyond it we would have to invent people. Above H, any further AD increase is pure price level. Point G is where the curve stops being flat: inflation starts building there, but there is still spare capacity.
4. The same increase in AD happens near full employment instead — AD₂ crossing at F. What does the economy get?
Mostly inflation and very little extra output — an unfavourable growth/inflation trade-off. Near capacity the curve is steep: output crawls from Y₁ towards Yfe while the price level climbs from P₁ to P₂. There are just no more workers, so extra demand bids up wages and the rental price of capital and feeds straight into prices. That is the growth-versus-inflation trade-off the examiner wants named — and large stimulus into a supply-constrained economy after Covid is the real-world case.
5. Evaluation: what exactly do Keynesians and Classicals disagree about?
Whether wages fall in a recession. Classicals: a negative output gap pushes wages down, costs fall, SRAS shifts right and output returns to Yfe on its own — recessions are temporary and no debt-funded rescue is needed. Keynesians: workers will not accept nominal wage cuts even in a recession, so the economy is stuck at E with a permanent negative output gap and the only fix is to stimulate AD. Note what they AGREE on: at full capacity the Keynesian curve is vertical too. Exam rule of thumb — anything demand-side, draw the Keynesian curve; anything supply-side, draw the classical vertical one.
6. Evaluation: a supply-side policy shifts LRAS right while the economy is stuck at E on the flat range. What happens?
Almost nothing — potential output rises but actual output is held down by weak demand, so the spare capacity just gets bigger. Supply-side policy raises the ceiling; on the flat range actual output is constrained by demand, so the gap between potential and actual simply widens. During Covid the government ran Eat Out to Help Out — building more pubs would have been the wrong answer, because the shortage was demand, not capacity. In a lockdown you need more pub-goers, not more pubs. Demand-side problems need demand-side solutions, and putting that evaluation on a diagram is what separates the best students.
Now test yourself
Every point on this diagram has a letter. Answer with the points and the distances, exactly like the exam. Every wrong answer gets a diagnosis — that is the diagram telling you what to fix.