← A Level Economics Revision · All Keynesian LRAS (spare capacity) questions · Home
A-Level Economics · Keynesian LRAS (spare capacity) diagram question
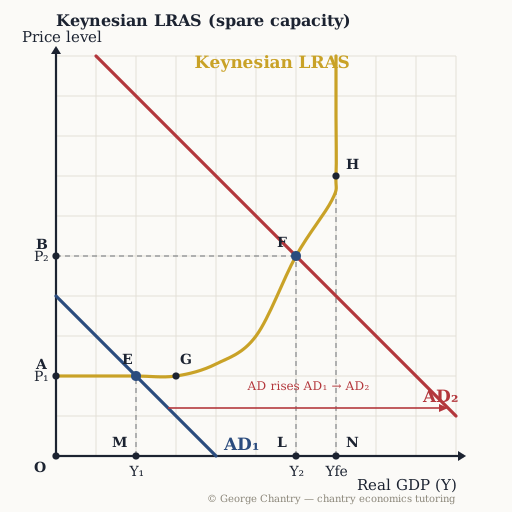
The SAME increase in AD happens near full employment instead — AD₂ crossing at F. What does the economy get?
The diagram
The answer
Mostly inflation and very little extra output — an unfavourable growth/inflation trade-off. You have loads more demand but you have run out of people — so all you do is push up prices. Near capacity the curve is steep: output crawls from Y₁ towards Yfe while the price level climbs from P₁ to P₂. There are just no more workers, so extra demand bids up wages and the rental price of capital and feeds straight into prices. That is the growth-versus-inflation trade-off the examiner wants named — and after Covid, large stimulus into a supply-constrained economy is the real-world case.
Test yourself properly
This is one of 6 questions on the keynesian lras (spare capacity) diagram — every corner lettered, every wrong answer diagnosed.
▶ Play the keynesian lras (spare capacity) game All questions & answers

George Chantry
Professional A-Level Economics tutor · Oxford PPE First, 3 prizes in economics · 7,000+ hours one-to-one