← A Level Economics Revision · Home

The currency appreciation diagram (hot money) — A-Level Economics
Play the game and get tested on every point of the diagram — every wrong answer gets a diagnosis. Then study the answers below. Measure what you don’t know, then fix what you don’t know.
The diagram
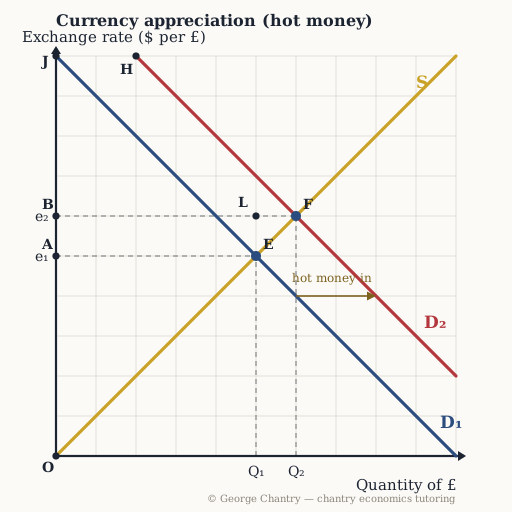
A rise in UK interest rates relative to the rest of the world makes Britain the best place to save — but London banks only take sterling deposits, so international savers must sell their own currency and buy pounds. That hot money inflow shifts demand right from D₁ to D₂, and the market moves from equilibrium E (e₁, Q₁) to equilibrium F (e₂, Q₂): the pound appreciates, and more pounds change hands.
The game’s questions — with the answers explained on the diagram
These are the exact questions the game asks. Play first if you want the real test — or study them here with the answer for each one.
1. What shifts the demand for pounds right from D₁ to D₂?
A rise in UK interest rates relative to the rest of the world. Hot money is money that moves fast to the best return. To earn London’s rate you need pounds, so savers sell euros or yen and buy sterling. On £100,000, 5% pays £5,000 a year against £1,000 at 1% — £4,000 more just for moving the money, and the only way to get it is to buy pounds. Note that a rate cut, higher UK imports and quantitative easing all work the other way, through the supply curve.
2. Which point on the exchange-rate axis is the appreciated pound?
B. D₂ meets S at point F; read across to the axis to get e₂, point B. Appreciation means each pound buys more dollars, so B sits above A.
3. Which point is the new equilibrium after demand for pounds shifts to D₂?
F. The shift moves the market straight from E to F. Be precise about what rises: the price of the pound and the quantity of pounds traded — not growth and inflation. That slip costs marks on this diagram.
4. The pound has appreciated from e₁ to e₂. What happens to UK imports?
Import prices fall in pounds, so under elastic demand expenditure on imports rises. Import prices are set abroad in foreign currency, which is exactly why a stronger pound lowers the price in pounds. If demand for imports is elastic, quantity rises proportionately more than price falls, so total import expenditure goes up. Combine that with falling export revenue and you get the classic appreciation-driven trade deficit.
5. What is the cost of the appreciation for UK exporters, and where does the chain end up?
Export prices in foreign currency rise, so foreigners buy fewer UK exports; X−M falls and AD shifts left. Run the whole chain and label every shift: rates up → hot money inflow → demand for the pound up → appreciation → exports dearer abroad and imports cheaper → trade deficit → (X−M) falls → AD1 to AD2. Exports are an injection, so losing them compounds — firms receive less, pay households less, households spend less — and the negative multiplier gives you AD3. Two macro objectives damaged at once: growth and the current account.
6. Evaluation: why link an interest-rate change to the exchange rate before the inflation effect?
Because financial markets are extremely efficient — the currency moves within minutes. A rate rise appreciates the currency almost immediately, even within minutes, because whoever gets the news fastest profits by buying the pound fastest. Demand-side policy takes roughly two years to filter through to inflation. So over the first couple of years the currency effect dominates export prices, even though lower inflation eventually makes exports a little cheaper too.
Now test yourself
Every corner has a letter. Answer with the points and areas, exactly like the exam. Every wrong answer gets a diagnosis — that is the diagram telling you what to fix.