← A Level Economics Revision · All Subsidy questions · Home
A-Level Economics · Subsidy diagram question
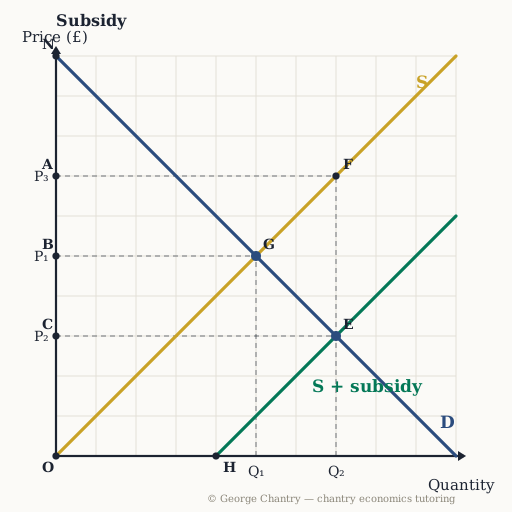
Which area is PRODUCER SURPLUS AFTER the subsidy?
The diagram
The answer
The triangle O A F. Above the ORIGINAL supply curve, below the £7 producers now receive, out to point F. Producers receive £7 per unit (price + subsidy) on 7 units: PS = area OAF, measured off the ORIGINAL S — their true costs didn't change.
Test yourself properly
This is one of 5 questions on the subsidy diagram — every corner lettered, every wrong answer diagnosed.
▶ Play the subsidy game All questions & answers

George Chantry
Professional A-Level Economics tutor · Oxford PPE First, 3 prizes in economics · 7,000+ hours one-to-one