← A Level Economics Revision · All Monopoly (supernormal profit) questions · Home
A-Level Economics · Monopoly (supernormal profit) diagram question
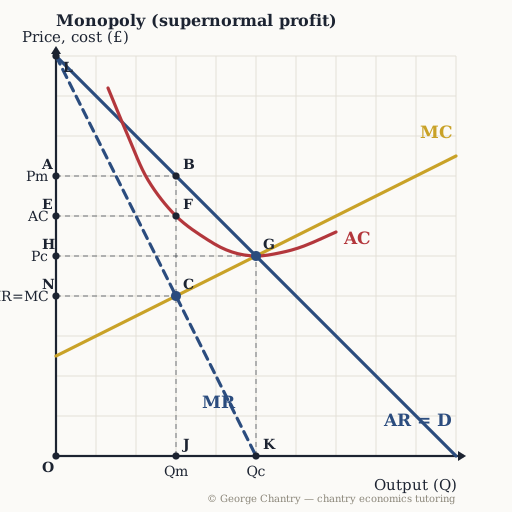
Compared with the competitive outcome at G, which area is the DEADWEIGHT WELFARE LOSS?
The diagram
The answer
The triangle B C G. Units 3 to 5 are worth more to buyers (AR) than they cost to make (MC), and the monopolist refuses to make them — triangle BCG, pointing at the competitive outcome G. Between Qm = 3 and Qc = 5 the demand curve sits above MC: those trades are worth doing and do not happen. Triangle BCG points at G. Price too high, quantity too low, resources misallocated — market failure caused directly by market power.
Test yourself properly
This is one of 6 questions on the monopoly (supernormal profit) diagram — every corner lettered, every wrong answer diagnosed.
▶ Play the monopoly (supernormal profit) game All questions & answers

George Chantry
Professional A-Level Economics tutor · Oxford PPE First, 3 prizes in economics · 7,000+ hours one-to-one