← A Level Economics Revision · Home

The monopoly diagram — A-Level Economics
Play the game and get tested on every point of the diagram — every wrong answer gets a diagnosis. Then study the answers below. Measure what you don’t know, then fix what you don’t know.
The diagram
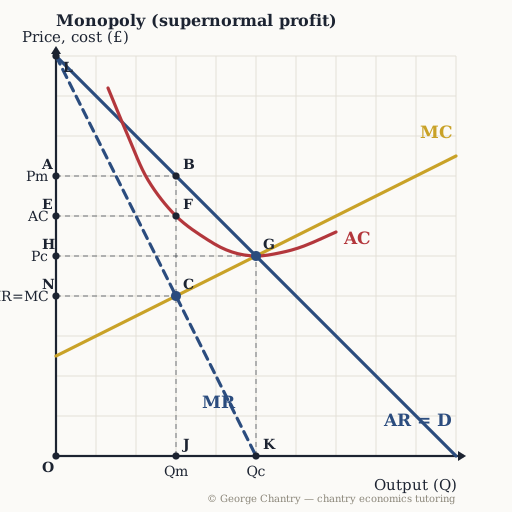
First step, draw. Second step, explain. Draw AR, then MR — MR is twice as steep. Add MC and AC. Profit is maximised where MR = MC at C; from there you read up to the demand curve at B, then across to the price axis: Pm = £7 on 3 units. Average cost at that output is F, so the supernormal profit box is A B F E. G is the competitive, allocatively efficient outcome where AR = MC — and it is also the bottom of the average cost curve.
The game’s questions — with the answers explained on the diagram
These are the exact questions the game asks. Play first if you want the real test — or study them here with the answer for each one.
1. The monopolist is a profit maximiser. At which point does it decide its OUTPUT?
C. MR = MC at point C, quantity 3. Every unit up to there adds more revenue than it adds cost. Find the output first — the price is a separate reading, and getting that order wrong is where the marks go.
2. Which point on the price axis is the monopoly price, Pm?
A. The routine is: find MR = MC (C), read UP to AR (B), then ACROSS to the axis (A) — £7. The £4 height where MR meets MC is a cost, not a price anyone pays. Reading the price off MC instead of AR is the single most expensive mistake on this diagram.
3. Which area is the monopolist’s supernormal profit?
The rectangle A B F E. Profit per unit is the price at the top minus average cost at the bottom, times the quantity: (£7 − £6) × 3. Drop the box to AC, never to MC. Then say why it survives: high barriers to entry stop rivals competing it away, which is exactly what perfect competition cannot do.
4. Compared with the competitive outcome at G, which area is the deadweight welfare loss?
The triangle B C G. Between Qm = 3 and Qc = 5 the demand curve sits above MC: those units are worth more to buyers than they cost to make, and the monopolist refuses to make them. The triangle points at G, the efficient outcome. Price too high, quantity too low, resources misallocated — market failure caused directly by market power.
5. Which point is the allocatively efficient outcome?
G. Allocative efficiency is AR = MC. That is the key sentence to write. The consumer pays exactly what the last unit costs to make, so resources are allocated according to consumer demand. The monopolist sits at C and charges B, far above marginal cost — allocatively inefficient, and that is the case against it in one line.
6. Evaluation: the monopolist keeps that profit rectangle year after year. What is the strongest case in favour of allowing it?
Reinvestment in research and development — dynamic efficiency. The evaluation lives inside the profit box. A B F E can fund technology and new products, shifting the AC curve down with some of the saving passed on — Apple turned monopoly-like profit into the iPhone, iPad, Watch and AirPods. But it could equally leave as dividends, wages or debt repayment, and with no rival there is no pressure to innovate at all. Argue both sides off the same rectangle.
Now test yourself
Every corner has a letter. Answer with the points and areas, exactly like the exam. Every wrong answer gets a diagnosis — that is the diagram telling you what to fix.