← A Level Economics Revision · All LRAS shift right (long-run growth) questions · Home
A-Level Economics · LRAS shift right (long-run growth) diagram question
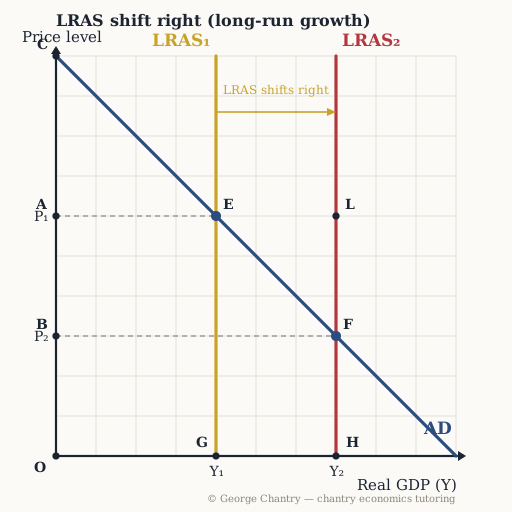
Which point on the price axis is the NEW price level after the LRAS shift?
The diagram
The answer
Point B. Read across from F: the price level falls from P₁ (A) to P₂ (B). Growth AND lower inflation together. Read across from the new equilibrium F to the price axis: point B, the lower price level P₂. With more capacity available, firms compete less aggressively for the same fixed pool of labour and capital, so wage and input-price growth slows and the price level falls.
Test yourself properly
This is one of 5 questions on the lras shift right (long-run growth) diagram — every corner lettered, every wrong answer diagnosed.
▶ Play the lras shift right (long-run growth) game All questions & answers

George Chantry
Professional A-Level Economics tutor · Oxford PPE First, 3 prizes in economics · 7,000+ hours one-to-one