← A Level Economics Revision · All Loanable funds (crowding out) questions · Home
A-Level Economics · Loanable funds (crowding out) diagram question
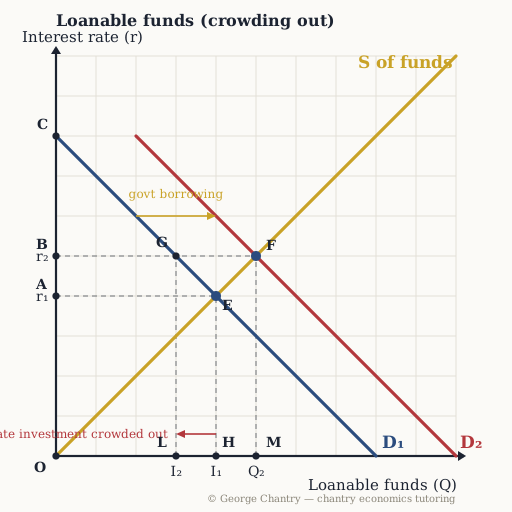
Which DISTANCE shows the private investment that has been crowded out?
The diagram
The answer
The distance L H. At the higher rate r₂, private demand read along D₁ has fallen from I₁ to I₂ — distance LH, squeezed out by the government. Find private investment on the ORIGINAL private demand curve D₁, at the new rate r₂: that is point G, giving quantity I₂ (point L on the axis). Before the government arrived it was I₁ (point H). The horizontal distance L to H is the private investment crowded out. Total lending went UP from 4 to 5 — but the private share went DOWN from 4 to 3. Both facts are true at once, and saying both is what earns the mark.
Test yourself properly
This is one of 6 questions on the loanable funds (crowding out) diagram — every corner lettered, every wrong answer diagnosed.
▶ Play the loanable funds (crowding out) game All questions & answers

George Chantry
Professional A-Level Economics tutor · Oxford PPE First, 3 prizes in economics · 7,000+ hours one-to-one