← A Level Economics Revision · All Laffer curve questions · Home
A-Level Economics · Laffer curve diagram question
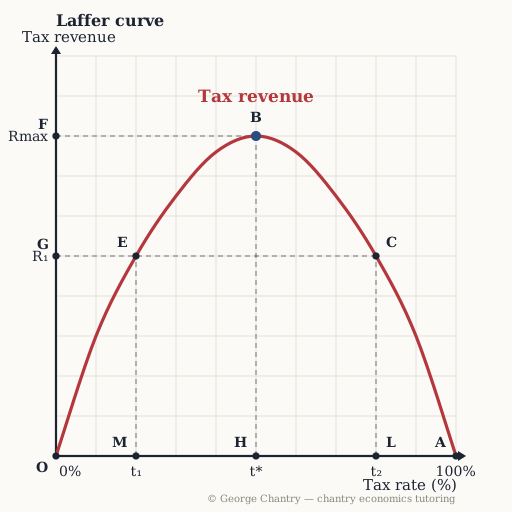
Point C raises exactly the same revenue as which other point on the curve — and why does that matter?
The diagram
The answer
Point E. Two rates, one revenue: t₁ (point E) and t₂ (point C) both raise R₁. The low rate gets there without the damage. Read across from C at R₁ and the horizontal guide hits the curve again at point E, the much lower rate t₁. Both rates raise identical revenue — but the low-rate route does it without discouraging work, without pushing people into evasion and without driving high earners abroad. That symmetry is the sharpest version of the Laffer argument, and it is a strong evaluation line in any 'should the government raise the top rate?' essay.
Test yourself properly
This is one of 5 questions on the laffer curve diagram — every corner lettered, every wrong answer diagnosed.
▶ Play the laffer curve game All questions & answers

George Chantry
Professional A-Level Economics tutor · Oxford PPE First, 3 prizes in economics · 7,000+ hours one-to-one