← A Level Economics Revision · All Laffer curve questions · Home
A-Level Economics · Laffer curve diagram question
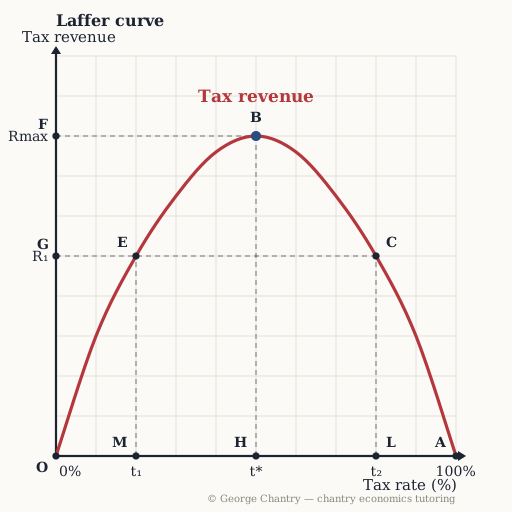
The economy is at point C, past the peak. The Chancellor raises the rate further. Which way does revenue move — and which point is it moving away from?
The diagram
The answer
Revenue FALLS as the economy slides further down the curve, away from the maximum at B. Past t*, raising the rate is self-defeating: work disincentives, evasion and emigration shrink the tax base faster than the rate grows it. Beyond the revenue-maximising rate, raising the rate lowers the government's own revenue. Three mechanisms: the income effect — workers hit a satisfactory target income with fewer hours, so they work less; tax evasion and avoidance become worth the trouble; and highly skilled workers and entrepreneurs emigrate to lower-tax jurisdictions. That last one bites hardest where the top 1% pay around 30% of all UK income tax — roughly £59 billion. The redistributive purpose of the rise is undermined alongside the revenue purpose.
Test yourself properly
This is one of 5 questions on the laffer curve diagram — every corner lettered, every wrong answer diagnosed.
▶ Play the laffer curve game All questions & answers

George Chantry
Professional A-Level Economics tutor · Oxford PPE First, 3 prizes in economics · 7,000+ hours one-to-one