← A Level Economics Revision · All Laffer curve questions · Home
A-Level Economics · Laffer curve diagram question
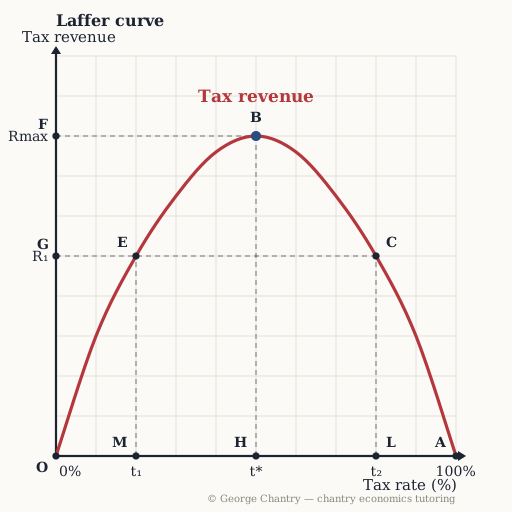
Why MUST a revenue-maximising tax rate exist somewhere between the two ends?
The diagram
The answer
Revenue is zero at 0% AND at 100%, but positive in between — connect the dots and there has to be a maximum somewhere. Two zeros at the ends, positive revenue in between: the curve has to rise and then fall, so it has to peak. Start from the endpoints: zero at 0%, zero at 100%. In between the government clearly collects something. Connect those dots and the curve must rise and then come back down — so there must be a maximum somewhere: the revenue-maximising rate. Note what the diagram does NOT tell you: where t* actually is. That is the honest limit of the model.
Test yourself properly
This is one of 5 questions on the laffer curve diagram — every corner lettered, every wrong answer diagnosed.
▶ Play the laffer curve game All questions & answers

George Chantry
Professional A-Level Economics tutor · Oxford PPE First, 3 prizes in economics · 7,000+ hours one-to-one