← A Level Economics Revision · All AD shift left (recession) questions · Home
A-Level Economics · AD shift left (recession) diagram question
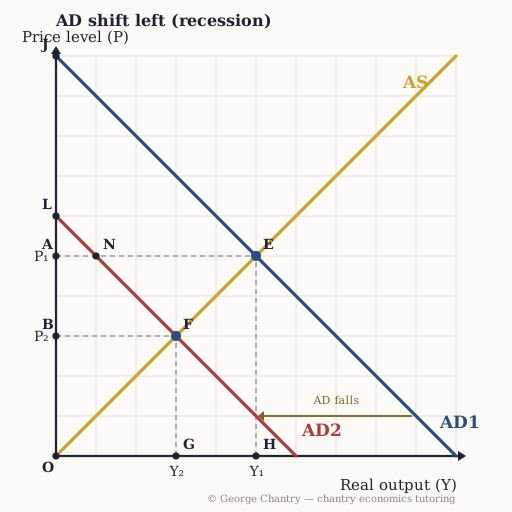
Investment collapses and AD shifts left from AD1 to AD2. Which distance is the FALL in real output?
The diagram
The answer
The distance G H. Y₁ down to Y₂ — real output falls from 5 to 3. That gap is the negative output gap the recession opens up. Read the fall off the OUTPUT axis between the two equilibria: H (Y₁ = 5) back to G (Y₂ = 3). The AD curve shifted left by 4, but output only falls by 2 — because the price level falls too and the economy slides back down AS. Confusing the shift with the fall in output is the standard error here.
Test yourself properly
This is one of 6 questions on the ad shift left (recession) diagram — every corner lettered, every wrong answer diagnosed.
▶ Play the ad shift left (recession) game All questions & answers

George Chantry
Professional A-Level Economics tutor · Oxford PPE First, 3 prizes in economics · 7,000+ hours one-to-one