← A Level Economics Revision · Home

The shift in supply diagram — A-Level Economics
Play the game and get tested on every point of the diagram — every wrong answer gets a diagnosis. Then study the answers below. Measure what you don’t know, then fix what you don’t know.
The diagram
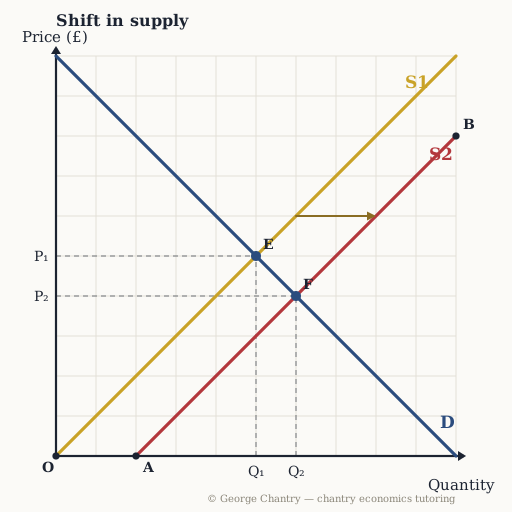
A fall in firms’ production costs shifts supply right from S1 to S2 — the gold arrow runs curve to curve at one price, which is how a shift is drawn. Demand never moves. The market slides along the unchanged demand curve from the old equilibrium E (P₁, Q₁) to the new equilibrium F (P₂, Q₂): price falls and quantity rises. Price down with quantity up is the signature of a rightward supply shift — and it is how you prove which curve moved when an extract does not tell you.
The game’s questions — with the answers explained on the diagram
These are the exact questions the game asks. Play first if you want the real test — or study them here with the answer for each one.
1. New technology cuts firms’ production costs, shifting S1 to S2. Which point is the new equilibrium?
F — where D crosses S2: £4, quantity 6. After the shift the market moves along D to where D crosses the new supply curve. The equilibrium is always a crossing, never an intercept and never the end of a curve.
2. What could cause this rightward shift of the supply curve?
A fall in firms’ production costs. A non-price factor changed: cheaper inputs or better technology mean more is supplied at every price. The classic trap is a change in the good’s own price — that moves you along the supply curve, an extension or a contraction, not a new curve. Only non-price factors (costs, technology, taxes, subsidies, the number of firms) shift it. Note the direction, too: an indirect tax raises sellers’ costs and shifts supply left.
3. What happens to price and quantity after the shift?
Price falls from £5 to £4 and quantity rises from 5 to 6. Supply right means price down and quantity up; demand right means price up and quantity up. That single contrast tells you which curve moved in any data-response extract.
4. Why does the price fall from £5 to £4?
At £5 there is now excess supply, which competes the price down. Point, cause, consequence: costs fall → supply shifts right → excess supply at the old price → the price is competed down → extension of demand along D → new equilibrium at F. The falling price signals, incentivises and rations until the market clears again — nobody is in charge of it.
5. After the shift, what has happened to demand?
Demand is unchanged — there is an extension of demand along D from E to F. Buyers moved along the curve; they did not move the curve. Writing “demand increased” here is the single most common way students throw away an easy mark: it is the right idea in the wrong words. “Extension of demand” earns the mark.
6. Evaluation: demand for this good is price inelastic. What does that mean for the same rightward supply shift?
Price falls a lot but quantity barely rises. A steeper demand curve means quantity demanded responds proportionately less than price, so the same shift drives price down sharply while quantity crawls up. And because the proportional fall in price outweighs the proportional gain in quantity, total revenue (P × Q) falls — the revenue box gets smaller. Draw the curve steep and the examiner can see you know why.
Now test yourself
Every corner has a letter. Answer with the points and areas, exactly like the exam. Every wrong answer gets a diagnosis — that is the diagram telling you what to fix.