← A Level Economics Revision · All Shift in supply questions · Home
A-Level Economics · Shift in supply diagram question
What happens to price and quantity after the shift?
The diagram
The answer
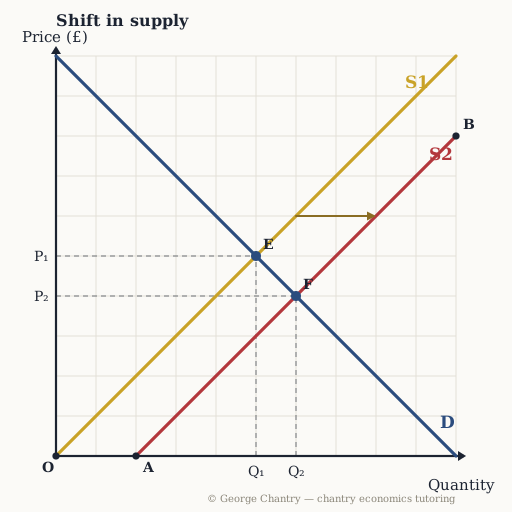
Price falls from £5 to £4 and quantity rises from 5 to 6. Supply right → price down, quantity up. Demand right → price up, quantity up. That one contrast identifies which curve moved in any extract. Read the new crossing off the diagram: E (£5, 5) becomes F (£4, 6). Price DOWN and quantity UP is the signature of a rightward supply shift — and it is how you prove which curve moved when the extract does not tell you.
Test yourself properly
This is one of 6 questions on the shift in supply diagram — every corner lettered, every wrong answer diagnosed.
▶ Play the shift in supply game All questions & answers

George Chantry
Professional A-Level Economics tutor · Oxford PPE First, 3 prizes in economics · 7,000+ hours one-to-one