← A Level Economics Revision · Home

The monopsony labour market diagram — A-Level Economics
Play the game and get tested on every point of the diagram — every wrong answer gets a diagnosis. Then study the answers below. Measure what you don’t know, then fix what you don’t know.
The diagram
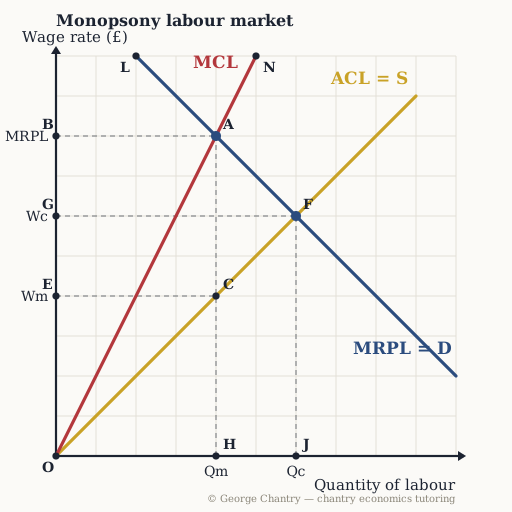
MCL sits above ACL because hiring one more worker means raising the wage of every worker. The monopsonist hires where MRPL = MCL at A — 4 workers — then reads down to the labour supply curve at C and pays only £4, well below the £8 that worker is worth. F is the competitive outcome where MRPL = ACL: 6 workers at £6. Fewer workers, paid less — and triangle A C F of welfare destroyed.
The game’s questions — with the answers explained on the diagram
These are the exact questions the game asks. Play first if you want the real test — or study them here with the answer for each one.
1. Which point decides how many workers the monopsonist employs?
A. The monopsonist hires where the marginal revenue product of labour equals the marginal cost of labour — point A, 4 workers. Employment first, wage second. Note that it hires fewer workers than the competitive market would at F.
2. Which point is the wage the monopsonist actually pays?
C. The monopsonist has to stay somewhere on the labour supply curve, and it wants to be as far down it as possible. So from A, read DOWN to the supply curve at C: £4. The firm could pay £8, but it does not need to — 4 workers will show up for £4. Reading the wage up at A, where MRPL meets MCL, is the single most common mistake on this diagram.
3. Why does MCL lie above ACL, the supply curve?
Because attracting one more worker means raising the wage of every existing worker. You cannot wage discriminate: everyone has to be paid the same. The NHS employs roughly 400,000 doctors. Offer one more doctor an extra £10 to join and you must give all 400,000 that £10 — a £4 million marginal cost from a £10 average one. A small rise in the average cost of labour is a huge rise in the marginal cost, which is why MCL sits above ACL and why the firm refuses to hire beyond A.
4. Which distance measures the exploitation of the workers?
The vertical distance C to A. Exploitation on this diagram means being paid below your marginal revenue product. Read it vertically at the monopsonist’s employment level: from the wage on the supply curve (C) up to MRPL (A) — £4 of value per worker that the firm keeps. Bargaining power is why it sticks: the monopsonist can make a take-it-or-leave-it offer, because the alternative for the worker is no job at all.
5. Which area is the welfare loss caused by the monopsonist’s under-hiring?
The triangle A C F. For every worker between Qm = 4 and Qc = 6, what they would produce (MRPL) exceeds what it would take to hire them (the supply curve). Those matches are worth making and the monopsonist refuses to make them, so the triangle is surplus destroyed — pointing, as always, at the efficient outcome F.
6. Evaluation: a minimum wage is set at the competitive wage. What happens in this market?
Both the wage and employment rise. This is the counter-intuitive result examiners wait for. A wage floor between the monopsony wage and the competitive wage removes the firm’s power to push the wage down, so the marginal cost of the next worker is simply the minimum wage — MCL becomes flat. The firm then hires where MRPL meets it, at F: the wage rises from £4 to £6 and employment rises from 4 to 6, recovering the welfare loss. A price control that improves the market, precisely because the market was uncompetitive to begin with. Card and Krueger’s 1994 New Jersey study found exactly this.
Now test yourself
Every corner has a letter. Answer with the points and areas, exactly like the exam. Every wrong answer gets a diagnosis — that is the diagram telling you what to fix.