← A Level Economics Revision · All Monopsony labour market questions · Home
A-Level Economics · Monopsony labour market diagram question
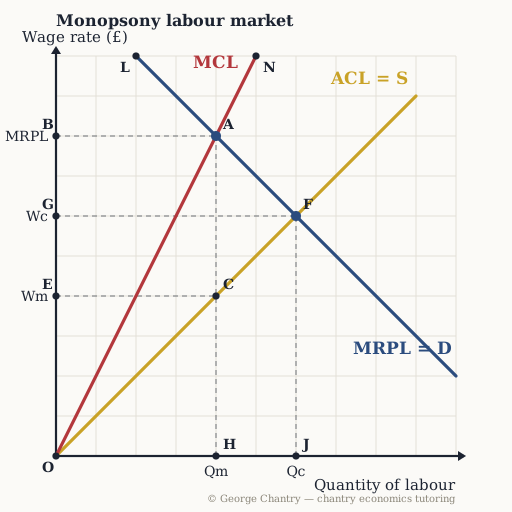
Why does MCL lie ABOVE ACL, the supply curve?
The diagram
The answer
To attract one more worker the firm must raise the wage of EVERY existing worker, so the true cost of that hire far exceeds their own wage. The NHS employs about 400,000 doctors. Offer one more £10 to join and you must give all 400,000 that £10 — a £4m marginal cost from a £10 average one. You cannot wage discriminate: everyone must be paid the same. So a £10 rise to attract the next doctor means a £10 rise for 400,000 doctors — £4 million at the margin. A small rise in the AVERAGE cost of labour is a huge rise in the MARGINAL cost, which is exactly why MCL sits above ACL, and why the firm refuses to hire beyond A.
Test yourself properly
This is one of 6 questions on the monopsony labour market diagram — every corner lettered, every wrong answer diagnosed.
▶ Play the monopsony labour market game All questions & answers

George Chantry
Professional A-Level Economics tutor · Oxford PPE First, 3 prizes in economics · 7,000+ hours one-to-one