← A Level Economics Revision · Home

The kinked demand curve diagram — A-Level Economics
Play the game and get tested on every point of the diagram — every wrong answer gets a diagnosis. Then study the answers below. Measure what you don’t know, then fix what you don’t know.
The diagram
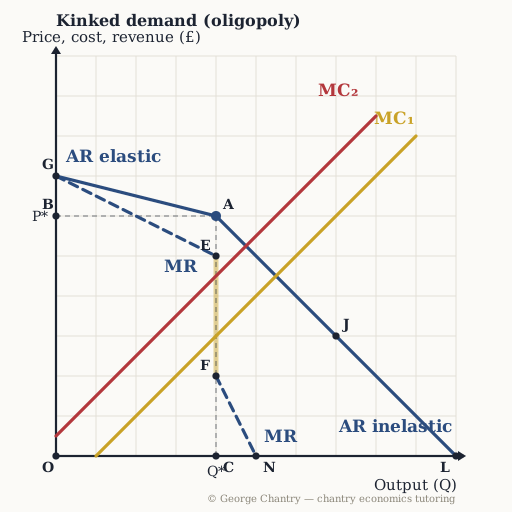
Demand kinks at A, the going price. Above it demand is elastic — rivals ignore a price rise, so you lose a lot of custom. Below it demand is inelastic — rivals match a price cut, so you gain very little. Each half generates its own marginal revenue curve, so MR jumps from E down to F. Notice there is deliberately no marked MC = MR point: both MC curves pass through that gap, and while MC stays inside it the profit-maximising price does not move at all. That absence is the model.
The game’s questions — with the answers explained on the diagram
These are the exact questions the game asks. Play first if you want the real test — or study them here with the answer for each one.
1. Which point is the kink — the going price the firm is currently charging?
A. Price P* on 4 units. Above the kink the demand curve is flat (elastic), below it steep (inelastic); the corner where those two behaviours meet is exactly where the firm sits. Do not read the price off the top of the MR gap — MR is a revenue calculation, never the price consumers pay.
2. Why is demand elastic above the kink?
Because rivals do not follow a price rise. Interdependence is strategic interaction. If I put my price up, my rivals are delighted to leave theirs alone and take my customers — so my quantity falls a long way for a small price rise. That is why the upper half of AR is drawn flat, and why raising the price is unattractive.
3. Why is demand inelastic below the kink?
Because rivals match a price cut immediately. A price cut steals customers, so rivals cannot afford to ignore it — they match it at once. Quantity therefore barely responds to my cut, and I have simply earned less on every unit. Put the two halves together and the firm has no reason to move its price in either direction.
4. Which distance is the discontinuity in marginal revenue — the MR gap?
The vertical distance E to F. Each half of the kinked demand curve generates its own marginal revenue curve, and the two do not meet. MR runs down to E, then restarts lower down at F. A kink in AR always produces a jump in MR, and that gap is the engine of the whole model.
5. The firm’s costs rise from MC₁ to MC₂. What happens to the price?
Nothing — the price stays at P*. Both marginal cost curves pass through the MR gap, so there is no output at which the MR = MC comparison comes out differently. The profit-maximising output is still Q* and the price is still P*. Costs move and the price sticks — that is price rigidity, and it is the model’s whole payoff.
6. Evaluation: prices in a market have not moved for two years. What does this diagram let you say about it?
Sticky prices are not proof of a cartel. Rival-watching alone is enough to freeze a price: raise it and you are left out on your own, cut it and you are matched, so the price sits still even when costs move. That means observed price stability is consistent with collusion and with independent competition — a genuinely useful evaluation point. Keep it as the supporting model though: the cartel diagram and the payoff matrix carry a collusion essay.
Now test yourself
Every corner has a letter. Answer with the points and areas, exactly like the exam. Every wrong answer gets a diagnosis — that is the diagram telling you what to fix.