← A Level Economics Revision · Home

The J-curve diagram — A-Level Economics
Play the game and get tested on every point of the diagram — every wrong answer gets a diagnosis. Then study the answers below. Measure what you don’t know, then fix what you don’t know.
The diagram
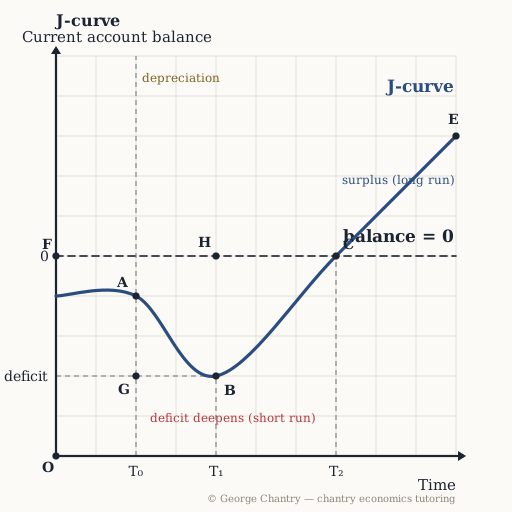
Time runs along the horizontal axis and the current account balance up the vertical axis, with the dashed zero line marking balance. The economy starts in deficit, and the depreciation happens at T₀, point A. Because demand for imports and exports is highly price-inelastic in the short run, the balance falls further into deficit to the trough at B (T₁), then climbs back through the zero line at C (T₂) and on into surplus at E once contracts roll off and Marshall-Lerner is satisfied.
The game’s questions — with the answers explained on the diagram
These are the exact questions the game asks. Play first if you want the real test — or study them here with the answer for each one.
1. A depreciation is supposed to improve the current account. Why does the balance fall from A down to B first?
Because in the short run demand for imports and exports is highly price-inelastic. Prices move on day one; quantities do not. Existing contracts tie buyers to their suppliers, and firms and consumers take time to find substitutes once the rate has moved. So imports get dearer but are still bought — import expenditure actually rises — while cheaper exports do not yet sell many more. The balance falls to the trough before it starts to climb.
2. Which point is the trough — the deepest the deficit gets?
B, at time T₁. The trough is the bottom of the J. Point A is where the depreciation happens, and the crucial exam point is that the deficit deepens after it. That lag is the whole reason the diagram exists.
3. Which point shows the current account back in balance?
C, at time T₂. Back in balance means the curve crosses the zero line. Before T₂ the economy is still in deficit; after it, in surplus, heading towards E. Reading the zero line rather than the curve is the classic slip here.
4. What exactly does the Marshall-Lerner condition require?
PEDx + PEDm > 1. The sum of the price elasticities of demand for exports and imports must exceed one. The proportional rise in quantity has to beat the proportional fall in export price for export revenue to rise, and import demand must respond enough for import expenditure to fall. Picture the price-times-quantity boxes: if the export price falls 50% and quantity rises only 10%, the new box is smaller — revenue falls, and the depreciation deepens the deficit.
5. Evaluation: what is the reason the short run differs from the long run?
Contracts. The examiner wants the mechanism named, not the lag asserted. A London factory that has signed a dollar contract for American oil must honour it even after the pound falls; only when the contract comes up for renewal — or a termination clause and its notice period run out — can the firm take the time to find another supplier. Once contracts end and agents adjust to a permanently lower pound, elasticities rise, PEDx + PEDm exceeds 1, and the balance climbs from B through C to E.
6. Evaluation: which real-world episode is the textbook J-curve?
The 2016 fall in sterling after the Brexit vote. The pound dropped roughly 10% overnight after the referendum and about 15% by that autumn, and the UK trade balance deteriorated rather than improved, because British demand for imports proved inelastic — consumers kept buying imports regardless of the higher price. That is the J-curve’s short-run dip observed in the data, and it is why policy should not expect quick fixes from currency moves.
Now test yourself
Every corner has a letter. Answer with the points and areas, exactly like the exam. Every wrong answer gets a diagnosis — that is the diagram telling you what to fix.