← A Level Economics Revision · All J-curve questions · Home
A-Level Economics · J-curve diagram question
EVALUATION: which real-world episode is the textbook J-curve?
The diagram
The answer
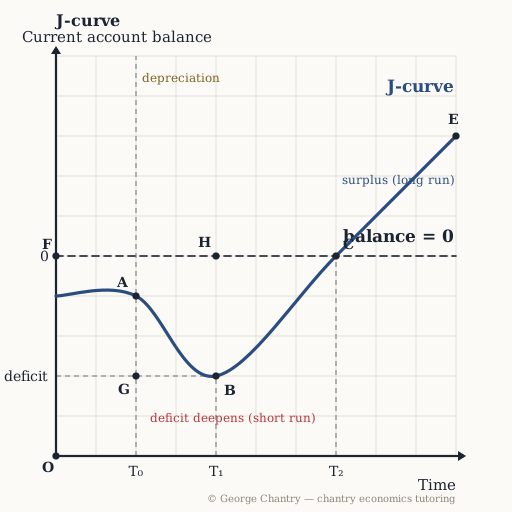
After the 2016 Brexit vote sterling fell roughly 15% and the UK trade balance initially got WORSE — British demand for imports proved inelastic. Brexit is the clean case: sterling fell around 15% and the trade balance got worse first, because British consumers kept buying imports regardless of the price. The 2016 referendum illustrates this perfectly: sterling dropped roughly 10% overnight and about 15% by that autumn, and the UK trade balance deteriorated rather than improved, because UK demand for imports was inelastic. That is the J-curve's short-run dip, observed in the data — and it is why policy shouldn't expect quick fixes from currency moves.
Test yourself properly
This is one of 6 questions on the j-curve diagram — every corner lettered, every wrong answer diagnosed.
▶ Play the j-curve game All questions & answers

George Chantry
Professional A-Level Economics tutor · Oxford PPE First, 3 prizes in economics · 7,000+ hours one-to-one