← A Level Economics Revision · Home

The shift in demand diagram — A-Level Economics
Play the game and get tested on every point of the diagram — every wrong answer gets a diagnosis. Then study the answers below. Measure what you don’t know, then fix what you don’t know.
The diagram
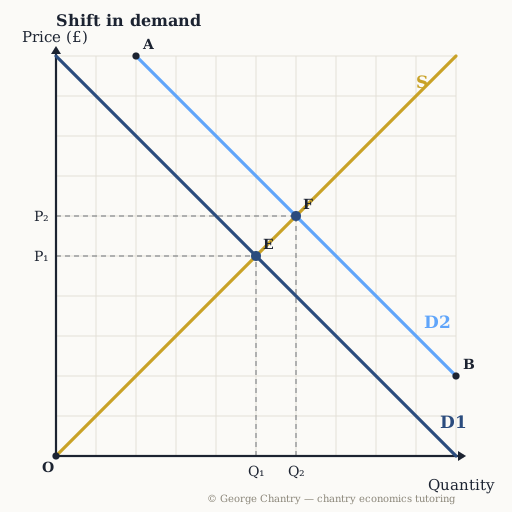
The whole demand curve moves right from D₁ to D₂ — from A at its top end to B at its bottom end. Supply never moves: it runs up through the origin O, and the market slides along it from the old equilibrium E (P₁, Q₁ — £5, quantity 5) to the new one at F (P₂, Q₂ — £6, quantity 6). Both price and quantity rise.
The game’s questions — with the answers explained on the diagram
These are the exact questions the game asks. Play first if you want the real test — or study them here with the answer for each one.
1. Incomes rise and this is a normal good, shifting D₁ to D₂. Which point is the NEW equilibrium?
F. After the shift the market moves along S to where S crosses the NEW demand curve — point F: £6, quantity 6. Both price AND quantity rise. (Staying at the old equilibrium E is the classic error; so is picking D₂’s intercept at A or its far end at B, neither of which is a crossing.)
2. What could cause this rightward SHIFT of the demand curve?
A rise in consumer incomes. A non-price factor changed: more income means more demanded at EVERY price, so the whole curve moves. That is the classic trap — a change in the good’s OWN price moves you ALONG the curve. Only non-price factors (incomes, tastes, other goods’ prices) SHIFT it, and a change in firms’ costs shifts supply, not demand.
3. Why does price rise from £5 to £6 after the shift?
At £5 there is now excess demand, which bids the price up. Point, cause, consequence: at the old price of £5 buyers now want more than sellers offer, and that excess demand bids the price up until the market clears at £6. The full chain: incomes rise → demand shifts right → excess demand at £5 → price bid up → extension of supply → new equilibrium at F. (Costs never changed and supply never moved — the pressure comes from buyers.)
Now test yourself
Every corner has a letter. Answer with the points and areas, exactly like the exam. Every wrong answer gets a diagnosis — that is the diagram telling you what to fix.