← A Level Economics Revision · All Shift in demand questions · Home
A-Level Economics · Shift in demand diagram question
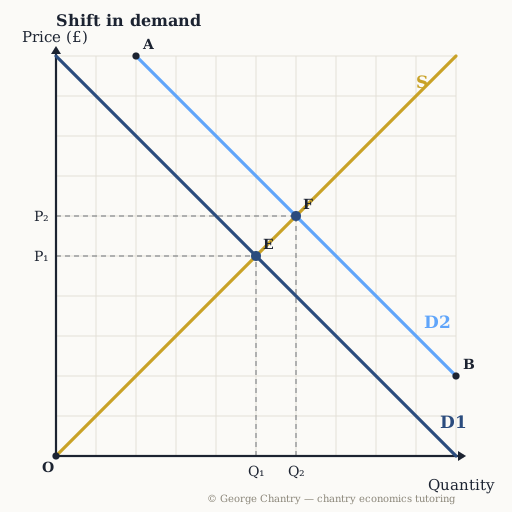
Incomes rise and this is a normal good, shifting D1 to D2. Which point is the NEW equilibrium?
The diagram
The answer
Point F. S crosses D2 at point F: £6, quantity 6 — both price AND quantity rise. After the shift the market moves along S to where S crosses the NEW demand curve — point F: £6, quantity 6.
Test yourself properly
This is one of 3 questions on the shift in demand diagram — every corner lettered, every wrong answer diagnosed.
▶ Play the shift in demand game All questions & answers

George Chantry
Professional A-Level Economics tutor · Oxford PPE First, 3 prizes in economics · 7,000+ hours one-to-one