← A Level Economics Revision · Home

The currency depreciation diagram — A-Level Economics
Play the game and get tested on every point of the diagram — every wrong answer gets a diagnosis. Then study the answers below. Measure what you don’t know, then fix what you don’t know.
The diagram
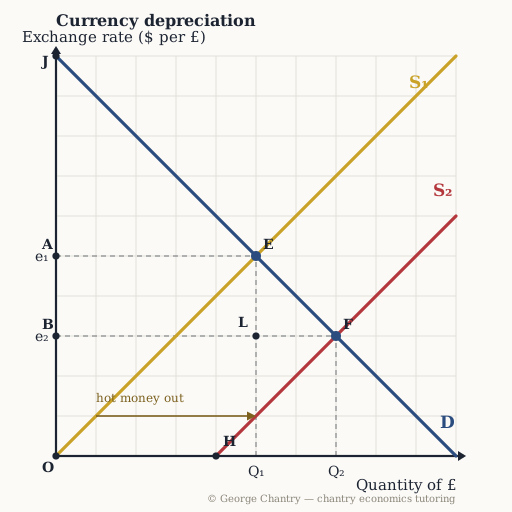
The y-axis is the price of one currency in terms of another — dollars per pound — and the x-axis is the quantity of pounds traded. A cut in UK interest rates sends hot money out of Britain: savers sell pounds to buy dollars or euros, so the supply of sterling shifts right from S₁ to S₂. The market moves from equilibrium E (e₁, Q₁) to equilibrium F (e₂, Q₂): the pound depreciates, and more pounds change hands.
The game’s questions — with the answers explained on the diagram
These are the exact questions the game asks. Play first if you want the real test — or study them here with the answer for each one.
1. A cut in UK interest rates moves the supply of pounds from S₁ to S₂. What is actually happening in the market to push it right?
UK savers move their money abroad to chase better rates — they sell pounds. That selling is the hot money outflow. The step most students skip is that for supply to shift, somebody must actually be selling the pound: UK rates fall → savers think they are getting a bad deal → to save in New York or Paris they must sell pounds and buy dollars or euros → that outflow is the extra supply, S₁ to S₂. Quantitative easing does the same job by raising the money supply directly.
2. Which point on the exchange-rate axis is the depreciated pound?
B. Find the new crossing first — S₂ meets D at point F — then read across to the exchange-rate axis: point B, e₂. Depreciation means the pound buys fewer dollars, so B sits below A.
3. Which point is the new equilibrium after the supply of pounds shifts to S₂?
F. After any shift, go to where the new curve crosses the one that did not move. S₂ meets D at F: a lower pound (e₂) and more pounds changing hands (Q₂). Note what actually rises here — the quantity of currency traded, not output.
4. The pound has fallen from e₁ to e₂. What happens to UK exports?
They become cheaper to foreign buyers, so demand for exports rises and export revenue rises. A foreigner now needs fewer dollars to buy a pound’s worth of UK goods. X rises, M falls, X−M improves, AD shifts right — and you may as well add the multiplier on top. Do not confuse this with a fall in the domestic price level: inflation is a nominal figure in pounds and takes no account of the exchange rate.
5. Evaluation: who loses from the depreciation?
UK importers and the consumers who buy imported goods. Depreciation makes imports more expensive, and dearer imported energy and food shift SRAS left — a cost-push shock. Inflation rises, real output falls, unemployment rises, and because inflation rises UK exports eventually become more expensive too. You can win the whole “evaluate a depreciation” essay on this chain without ever mentioning Marshall-Lerner.
Now test yourself
Every corner has a letter. Answer with the points and areas, exactly like the exam. Every wrong answer gets a diagnosis — that is the diagram telling you what to fix.