← A Level Economics Revision · All Currency depreciation questions · Home
A-Level Economics · Currency depreciation diagram question
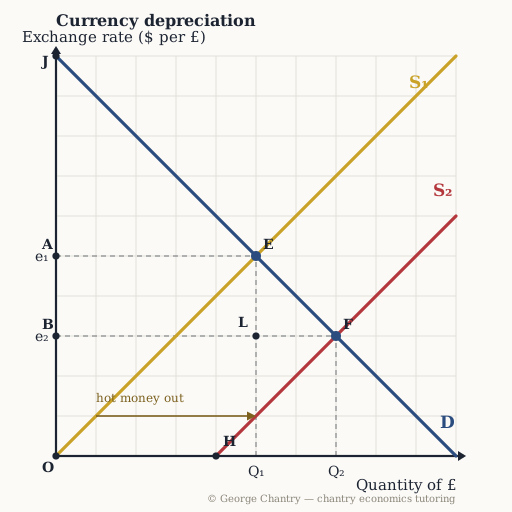
A cut in UK interest rates moves the supply of pounds from S₁ to S₂. What is actually happening in the market to push it right?
The diagram
The answer
UK savers move their money abroad to chase better rates — they SELL pounds, and that selling is the hot money outflow. The step most students skip: for supply to shift, somebody must actually be SELLING the pound. Rate cut → savers move money out → they sell sterling → S₁ to S₂. You can't just assert that supply shifts. Fill in every link: UK rates fall → savers think 'I'm only getting 1% here' → to save in New York or Paris they must SELL pounds and buy dollars or euros → that hot money outflow IS the extra supply, S₁ to S₂ → new equilibrium at F, a weaker pound. Quantitative easing does the same job by raising the money supply.
Test yourself properly
This is one of 5 questions on the currency depreciation diagram — every corner lettered, every wrong answer diagnosed.
▶ Play the currency depreciation game All questions & answers

George Chantry
Professional A-Level Economics tutor · Oxford PPE First, 3 prizes in economics · 7,000+ hours one-to-one