← A Level Economics Revision · All SRAS shift left (cost-push inflation) questions · Home
A-Level Economics · SRAS shift left (cost-push inflation) diagram question
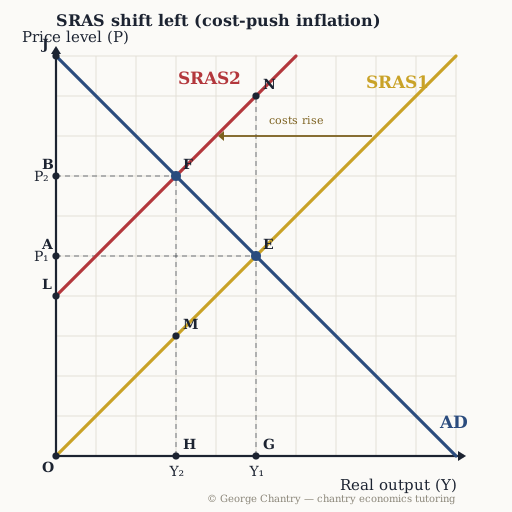
Which of these shifts SRAS to the LEFT?
The diagram
The answer
A sharp rise in energy and raw-material prices, raising every firm's costs of production. SRAS is a cost curve. Anything that raises firms' costs — energy, raw materials, wages — pushes it left and up. Ask one question of every candidate: does it change what it COSTS firms to produce? Falling petrol, gas, electricity and food prices shift SRAS right; rising ones shift it left. Confidence and tax cuts change spending, so they move AD instead. Sorting cost changes from demand changes is half the marks on this topic.
Test yourself properly
This is one of 6 questions on the sras shift left (cost-push inflation) diagram — every corner lettered, every wrong answer diagnosed.
▶ Play the sras shift left (cost-push inflation) game All questions & answers

George Chantry
Professional A-Level Economics tutor · Oxford PPE First, 3 prizes in economics · 7,000+ hours one-to-one