← A Level Economics Revision · All Short-run Phillips curve questions · Home
A-Level Economics · Short-run Phillips curve diagram question
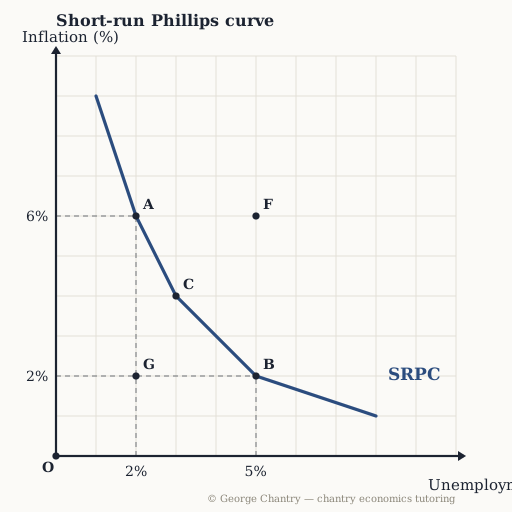
The economy moves along the curve from B to A. What has happened?
The diagram
The answer
A demand-side boom: AD rises, output and employment rise, and inflation rises with them. Labour is derived demand: more demand for goods and services means more workers needed, so unemployment falls — and the demand-pull pressure pushes inflation up. Point, cause, consequence. Moving DOWN-LEFT along the curve is the demand-side story: AD shifts right, growth and employment rise, and inflation rises alongside them. That is what the short-run Phillips curve is for — showing the trade-off that demand-side policy forces on you.
Test yourself properly
This is one of 5 questions on the short-run phillips curve diagram — every corner lettered, every wrong answer diagnosed.
▶ Play the short-run phillips curve game All questions & answers

George Chantry
Professional A-Level Economics tutor · Oxford PPE First, 3 prizes in economics · 7,000+ hours one-to-one