← A Level Economics Revision · All Short-run Phillips curve questions · Home
A-Level Economics · Short-run Phillips curve diagram question
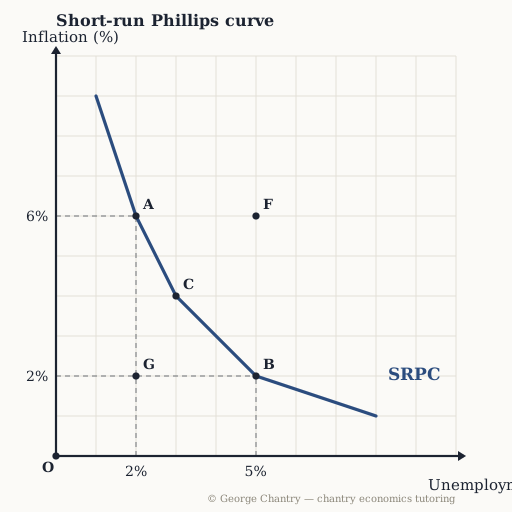
Which point shows LOW unemployment with HIGH inflation?
The diagram
The answer
Point A. A: unemployment 2%, inflation 6%. Read across to the vertical axis and down to the horizontal one — the dashed guides do the work for you. Unemployment is on the HORIZONTAL axis, inflation on the vertical. Low unemployment therefore means far LEFT, and high inflation means high up: point A, 2% unemployment with 6% inflation.
Test yourself properly
This is one of 5 questions on the short-run phillips curve diagram — every corner lettered, every wrong answer diagnosed.
▶ Play the short-run phillips curve game All questions & answers

George Chantry
Professional A-Level Economics tutor · Oxford PPE First, 3 prizes in economics · 7,000+ hours one-to-one