← A Level Economics Revision · All Maximum price questions · Home
A-Level Economics · Maximum price diagram question
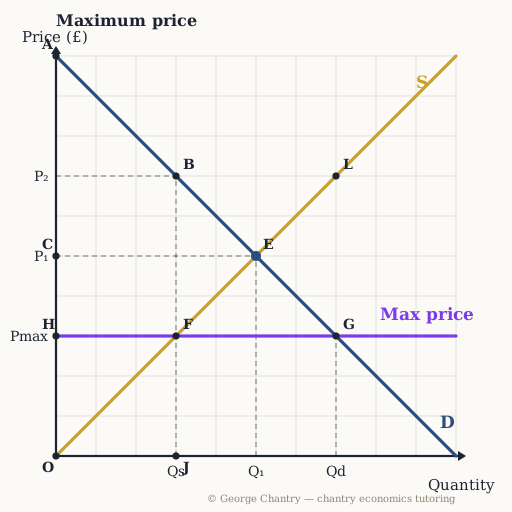
Which distance shows the SHORTAGE the cap creates?
The diagram
The answer
The distance F G. Qd 7 − Qs 3 = 4 units of unmet demand at the capped price — hence queues and waiting lists. Shortage = the horizontal gap AT the capped price: demanded (G) minus supplied (F) = 4 units. That gap is why price caps bring queues and black markets.
Test yourself properly
This is one of 6 questions on the maximum price diagram — every corner lettered, every wrong answer diagnosed.
▶ Play the maximum price game All questions & answers

George Chantry
Professional A-Level Economics tutor · Oxford PPE First, 3 prizes in economics · 7,000+ hours one-to-one