← A Level Economics Revision · All Lorenz curve questions · Home
A-Level Economics · Lorenz curve diagram question
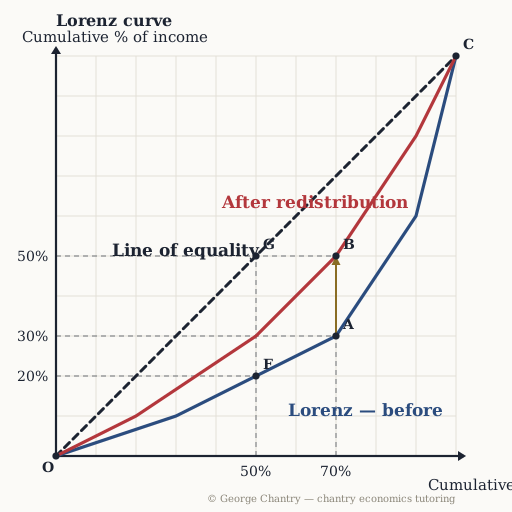
Which distance shows how much redistribution raised the income share of the poorest 70%?
The diagram
The answer
The distance A B. Vertical, at one fixed population share: the income share of the poorest 70% rising from 30% to 50%. Measure this shift the way you measure a shift in supply: fix ONE point on the horizontal axis and read the vertical gap between the two curves. At 70% of the population that is A up to B — 30% of income becoming 50%.
Test yourself properly
This is one of 6 questions on the lorenz curve diagram — every corner lettered, every wrong answer diagnosed.
▶ Play the lorenz curve game All questions & answers

George Chantry
Professional A-Level Economics tutor · Oxford PPE First, 3 prizes in economics · 7,000+ hours one-to-one