← A Level Economics Revision · All Lorenz curve questions · Home
A-Level Economics · Lorenz curve diagram question
EVALUATION: what does the Gini coefficient actually measure?
The diagram
The answer
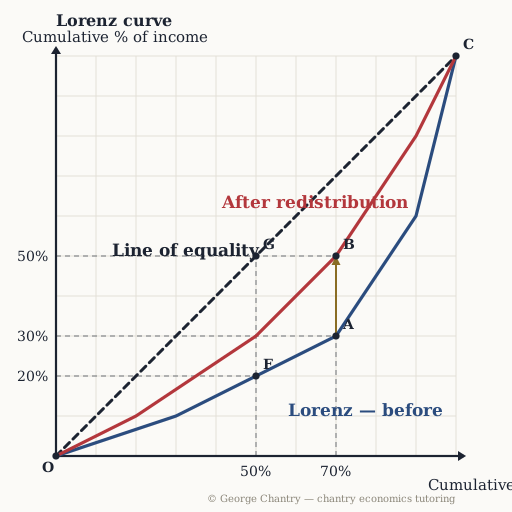
The distance between the line of perfect equality and the Lorenz curve — 0 means everyone is equal, 1 means one person owns everything. One number for the whole gap. UK income Gini is about 0.343; wealth is far more unequal at roughly 0.62 — worth quoting, because it separates income inequality from wealth inequality. The Gini coefficient measures the distance between the line of perfect equality and the Lorenz curve, on a scale from 0 to 1. Small distance → small Gini → more equal. That is why the sentence to write is always 'the curve shifts in and the Gini coefficient falls towards zero'.
Test yourself properly
This is one of 6 questions on the lorenz curve diagram — every corner lettered, every wrong answer diagnosed.
▶ Play the lorenz curve game All questions & answers

George Chantry
Professional A-Level Economics tutor · Oxford PPE First, 3 prizes in economics · 7,000+ hours one-to-one