← A Level Economics Revision · All Lorenz curve questions · Home
A-Level Economics · Lorenz curve diagram question
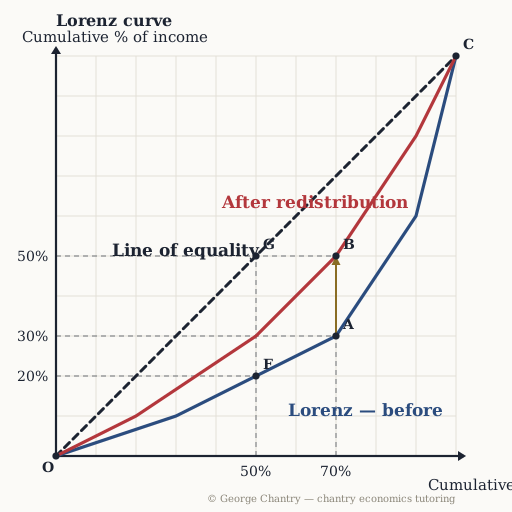
What does the straight 45° line represent?
The diagram
The answer
Perfect equality — every x% of the population receives exactly x% of the income. On the line, the poorest 50% would take 50% of the income — point G. No real economy looks like that; it is the yardstick everything else is measured against. The 45° line is the line of perfect equality: each slice of the population receives exactly its own share of income. Real distributions sag below it, and the distance between the line and the curve IS the inequality.
Test yourself properly
This is one of 6 questions on the lorenz curve diagram — every corner lettered, every wrong answer diagnosed.
▶ Play the lorenz curve game All questions & answers

George Chantry
Professional A-Level Economics tutor · Oxford PPE First, 3 prizes in economics · 7,000+ hours one-to-one