← A Level Economics Revision · All World price above equilibrium (exports) questions · Home
A-Level Economics · World price above equilibrium (exports) diagram question
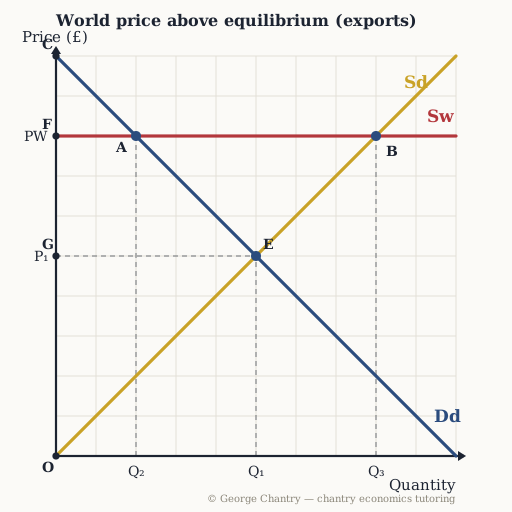
Which area is the GAIN in producer surplus from trading at the world price?
The diagram
The answer
The area G E B F. PS goes from OGE to OFB; the slice added is GEBF — a higher price on the units they already made, plus the surplus on the extra units Q₁ to Q₃. Before and after again: PS before is OGE, PS after is OFB, and the difference is GEBF — the price rise on existing output plus the surplus on the new output that exporting makes worth producing. Part of that slice is transferred straight from domestic consumers, whose surplus falls to CFA.
Test yourself properly
This is one of 6 questions on the world price above equilibrium (exports) diagram — every corner lettered, every wrong answer diagnosed.
▶ Play the world price above equilibrium (exports) game All questions & answers

George Chantry
Professional A-Level Economics tutor · Oxford PPE First, 3 prizes in economics · 7,000+ hours one-to-one