← A Level Economics Revision · All World price above equilibrium (exports) questions · Home
A-Level Economics · World price above equilibrium (exports) diagram question
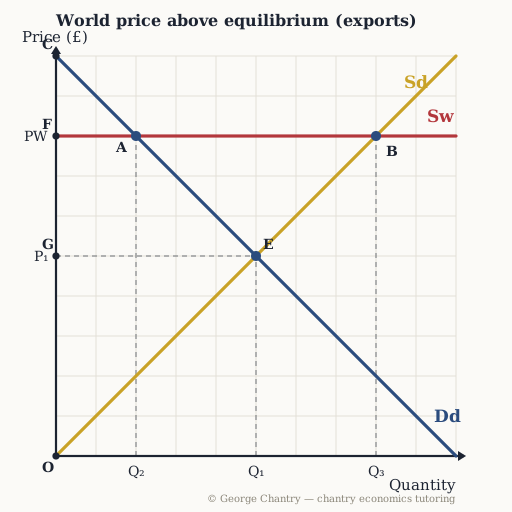
Which point shows the quantity domestic CONSUMERS buy at the world price?
The diagram
The answer
Point A. Read across from PW to the DEMAND curve, then down: home buyers take only Q₂ (2) at that price. Quantity demanded always lives on Dd: across from PW to point A, then down — 2 units. Point B is on Sd, the quantity supplied. Two curves, two readings, never mixed.
Test yourself properly
This is one of 6 questions on the world price above equilibrium (exports) diagram — every corner lettered, every wrong answer diagnosed.
▶ Play the world price above equilibrium (exports) game All questions & answers

George Chantry
Professional A-Level Economics tutor · Oxford PPE First, 3 prizes in economics · 7,000+ hours one-to-one