← A Level Economics Revision · All Supply & demand questions · Home
A-Level Economics · Supply & demand diagram question
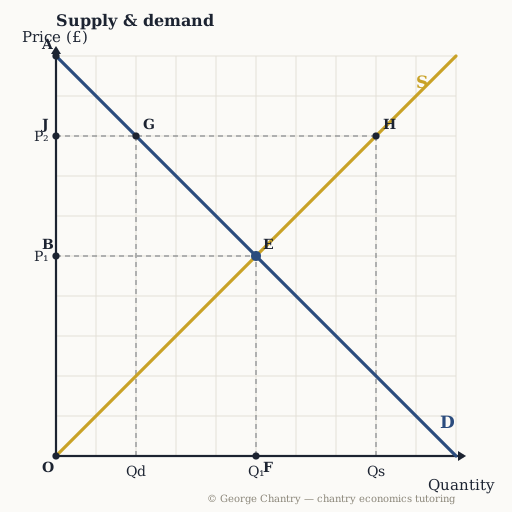
The price is fixed at £8. Which point shows the quantity DEMANDED?
The diagram
The answer
Point G. At £8, read ACROSS to the demand curve, then down: consumers only want 2. Quantity demanded lives on the DEMAND curve: across from £8 to point G, then down — 2 units.
Test yourself properly
This is one of 3 questions on the supply & demand diagram — every corner lettered, every wrong answer diagnosed.
▶ Play the supply & demand game All questions & answers

George Chantry
Professional A-Level Economics tutor · Oxford PPE First, 3 prizes in economics · 7,000+ hours one-to-one