← A Level Economics Revision · All Currency depreciation questions · Home
A-Level Economics · Currency depreciation diagram question
EVALUATION: who LOSES from the depreciation?
The diagram
The answer
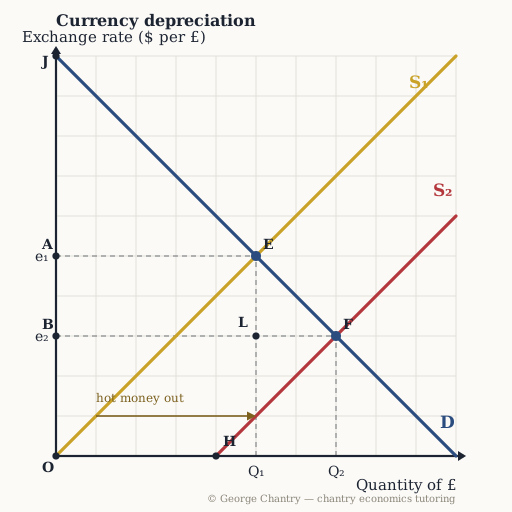
UK importers and consumers — imported energy and food cost more, SRAS shifts left and cost-push inflation rises. Dearer imports shift SRAS left: inflation up, growth down, unemployment up. That's the cost-push chain — and you can run it through all four macro objectives. The losers are importers and the consumers who buy imported goods. Chain it: depreciation → imports more expensive → SRAS shifts left → inflation rises → real output falls → unemployment rises — and because inflation rises, UK exports eventually become more expensive too, undoing the competitiveness gain. You can build a whole 'evaluate a depreciation' essay on this alone, without touching Marshall-Lerner.
Test yourself properly
This is one of 5 questions on the currency depreciation diagram — every corner lettered, every wrong answer diagnosed.
▶ Play the currency depreciation game All questions & answers

George Chantry
Professional A-Level Economics tutor · Oxford PPE First, 3 prizes in economics · 7,000+ hours one-to-one