← A Level Economics Revision · All AD/AS equilibrium questions · Home
A-Level Economics · AD/AS equilibrium diagram question
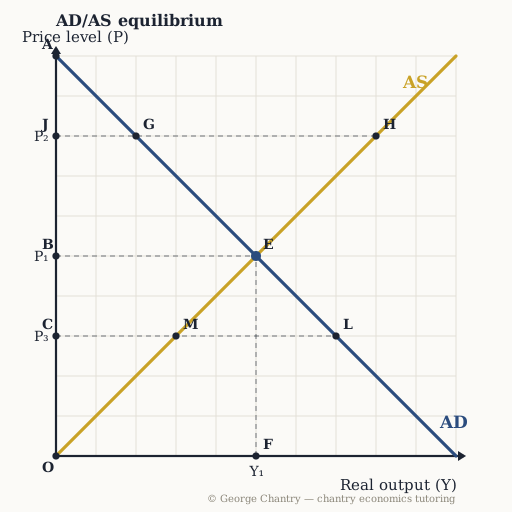
At the price level P₂ = 8, above equilibrium, this economy has…
The diagram
The answer
Excess supply of 6 — firms produce more than buyers will take, so the price level is bid down. Supplied 8 − demanded 2 = 6 of unsold output (the distance G to H). Unsold stock pushes the price level back down toward P₁. Above equilibrium, firms want to produce 8 (H) but buyers only take 2 (G) — excess supply of 6. Unsold output means firms cut prices and cut production, and the economy slides back down to E.
Test yourself properly
This is one of 6 questions on the ad/as equilibrium diagram — every corner lettered, every wrong answer diagnosed.
▶ Play the ad/as equilibrium game All questions & answers

George Chantry
Professional A-Level Economics tutor · Oxford PPE First, 3 prizes in economics · 7,000+ hours one-to-one