← A Level Economics Revision · All AD/AS equilibrium questions · Home
A-Level Economics · AD/AS equilibrium diagram question
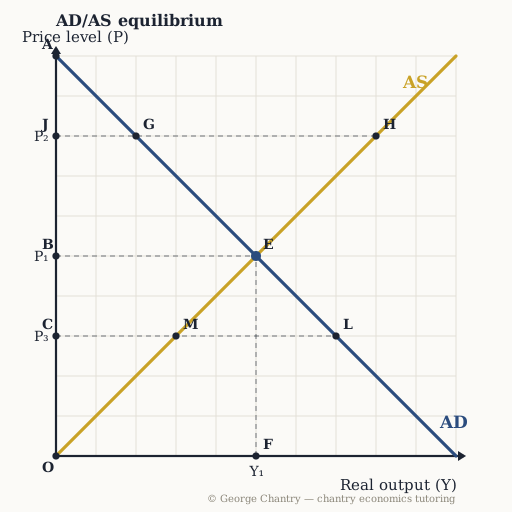
What does the HORIZONTAL axis of this diagram measure?
The diagram
The answer
Real output — real GDP, the volume of goods and services actually produced. Real output — real GDP. A rise from Y₁ to Y₂ IS economic growth, by definition. Price level on the vertical axis, real output on the horizontal. Real GDP rising is the definition of economic growth — which is why the whole macro course is read off this one pair of axes.
Test yourself properly
This is one of 6 questions on the ad/as equilibrium diagram — every corner lettered, every wrong answer diagnosed.
▶ Play the ad/as equilibrium game All questions & answers

George Chantry
Professional A-Level Economics tutor · Oxford PPE First, 3 prizes in economics · 7,000+ hours one-to-one