← A Level Economics Revision · Home

The consumer & producer surplus diagram — A-Level Economics
Play the game and get tested on every point of the diagram — every wrong answer gets a diagnosis. Then study the answers below. Measure what you don’t know, then fix what you don’t know.
The diagram
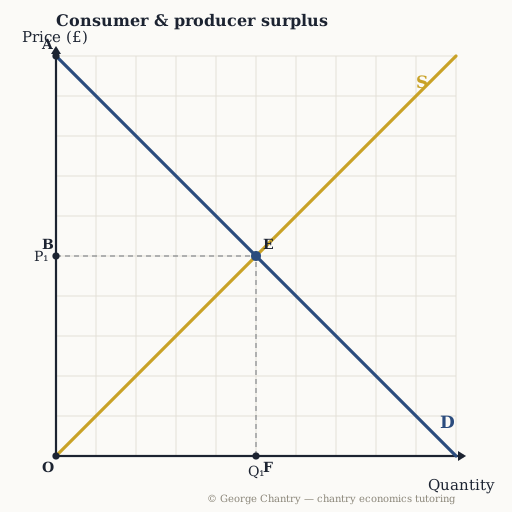
Demand runs down from A on the price axis; supply runs up from the origin O. They cross at E, giving price P₁ (£5, read across to B) and quantity Q₁ (5, read down to F). Every area the questions ask about is built from those five letters: A B E above the price line, B O E below it, A O E for the two together, and O F E B for the money that changes hands.
The game’s questions — with the answers explained on the diagram
These are the exact questions the game asks. Play first if you want the real test — or study them here with the answer for each one.
1. Which area is CONSUMER surplus?
The triangle A B E — below demand, above the price paid: the value received minus the money handed over. Consumer surplus is what consumers were WILLING to pay (under D) minus what they DID pay (£5), so it sits above the price line and below demand. (The classic error is swapping it with producer surplus; the other trap is picking O F E B, which is consumer SPENDING — price × quantity — not surplus at all.)
2. Which area is PRODUCER surplus?
The triangle B O E — above supply, which is their costs, and below the £5 they receive. Producer surplus is the price received minus the cost of each unit, and the supply curve is that cost. (Again, the two surpluses get swapped constantly, and O F E B is revenue rather than surplus.)
3. Which area shows TOTAL economic welfare (society’s surplus) at equilibrium?
The triangle A O E — consumer surplus AND producer surplus together, the whole wedge between D and S. This is what welfare loss ‘shaves off’: every welfare-loss question you meet is a bit being trimmed from this triangle. (Counting only consumers, or only producers, is the standard slip — and spending changes hands, so it isn’t surplus.)
Now test yourself
Every corner has a letter. Answer with the points and areas, exactly like the exam. Every wrong answer gets a diagnosis — that is the diagram telling you what to fix.