← A Level Economics Revision · Home

The import quota diagram — A-Level Economics
Play the game and get tested on every point of the diagram — every wrong answer gets a diagnosis. Then study the answers below. Measure what you don’t know, then fix what you don’t know.
The diagram
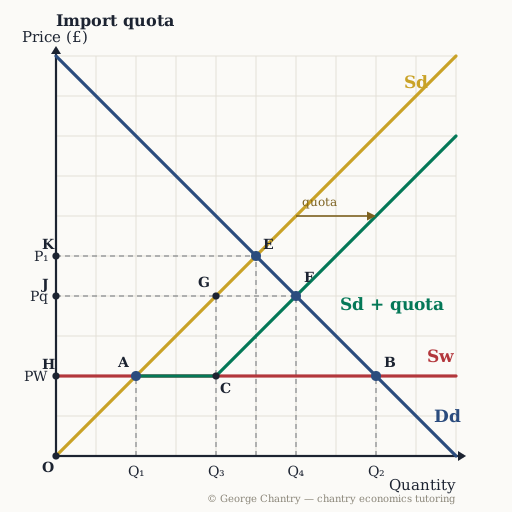
A quota is a physical cap on imports, not a tax. Under free trade domestic firms supply Q₁ (point A), buyers take Q₂ (point B) and imports are the whole gap A to B. Cap imports at Q₁ → Q₃ and total supply becomes Sd + quota: the market now clears at F, price Pq and quantity Q₄. Domestic supply extends along Sd from A to G, imports shrink to the gap G to F, and the quantity traded falls from Q₂ to Q₄.
The game’s questions — with the answers explained on the diagram
These are the exact questions the game asks. Play first if you want the real test — or study them here with the answer for each one.
1. What does an import quota actually do?
It caps imports at a fixed quantity — anything beyond that is banned. The government says it will allow 1,000 cars in, and the 1,000-and-first is banned. That is a physical limit, not a tax: the price effect follows from the restriction rather than being imposed directly.
2. With imports capped, which point is the market outcome?
F — price Pq, total quantity Q₄, where Sd + quota crosses Dd. Restricting world supply pushes the market back towards the domestic no-trade equilibrium: ban all imports and you travel the whole way back to E; delete only some of them and you stop part-way, at F.
3. Which distance shows imports after the quota?
G to F — the horizontal gap between Sd and Sd + quota at the ruling price, which is exactly the cap. Under free trade the gap was A to B. Read the revenue the way George teaches it and you get the same picture sliced differently: domestic producers supply O → Q₁ and again Q₃ → Q₄, with the fixed quota of imports sandwiched in the middle.
4. How does the quota’s price effect compare with a tariff’s?
Both push the domestic price above the world price — the quota does it by restricting quantity, not by taxing each unit. Same destination, different route: a tariff taxes imports up to PW + T; a quota starves the market of imports until the price climbs to Pq. In the extreme case of zero imports the price returns all the way to the no-trade level.
5. Who captures the higher price on the units that still come in under the quota?
The foreign suppliers who get the quota places — the government collects nothing. This is the sharpest contrast with a tariff, where foreign producers must hand the tax over to the government. Under a quota there is no tax to hand over. Domestic producers capture the higher price Pq on everything they make as well, which is why domestic industry lobbies hard for quotas.
6. Why does domestic supply rise after the quota is imposed?
The higher price draws domestic firms in — an extension of supply along Sd, from A to G. The chain: the quota restricts world supply → price rises to Pq → domestic firms extend supply along Sd → more domestic output, and because labour is a derived demand, more domestic jobs. The curve that shifts is Sd + quota; the domestic supply curve itself never moves.
Now test yourself
Every corner has a letter. Answer with the points and areas, exactly like the exam. Every wrong answer gets a diagnosis — that is the diagram telling you what to fix.