← A Level Economics Revision · Home

The positive production externality diagram — A-Level Economics
Play the game and get tested on every point of the diagram — every wrong answer gets a diagnosis. Then study the answers below. Measure what you don’t know, then fix what you don’t know.
The diagram
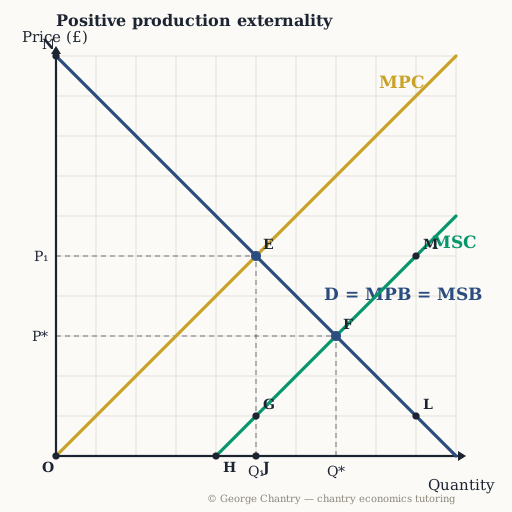
Demand is labelled D = MPB = MSB — the benefit to buyers is the whole benefit to buyers. The spillover is on the cost side: MSC is drawn BELOW MPC, because the firm’s activity confers a benefit on others that its own cost figures never capture. The market settles at E where MPC crosses D (P₁, Q₁ = 5); the social optimum is F where MSC crosses D (P*, Q* = 7).
The game’s questions — with the answers explained on the diagram
These are the exact questions the game asks. Play first if you want the real test — or study them here with the answer for each one.
1. A tech firm trains workers who spread skills to other firms: MSC sits BELOW MPC. Which point is the FREE-MARKET outcome?
E. Firms weigh their PRIVATE costs: MPC crosses D at point E, quantity 5 — society would like more. Producers ignore the benefit their training spills onto other firms, so the market settles there: an UNDERproduction. (Point F is the social optimum the market falls short of; G is the social cost of the market output, not where the market settles.)
2. Which point is the SOCIAL optimum?
F. Where the TRUE cost to society (MSC) meets benefit: point F, quantity 7. Society’s real cost is private cost minus the spillover benefit, and that curve crosses D there — more than the market delivers.
3. Which distance shows the MARGINAL EXTERNAL BENEFIT of the last unit the market produces?
The distance E G. MPC minus MSC at Q = 5: the £4 of spillover benefit per unit that firms don’t get paid for. The externality is the VERTICAL gap between MPC and MSC at the quantity in question — at market output that is E down to G. (Not the market price E to J, and not the gap between the two equilibria.)
4. Which area is the WELFARE GAIN society misses at the free-market output?
The triangle E G F. Units 5→7 are worth more (D) than their TRUE cost (MSC) — triangle EGF is the unrealised surplus. Between market (E) and optimum (F) each unit’s benefit on D exceeds its social cost on MSC, and the triangle points at the optimum: what society forgoes. (The classic error is drawing it the wrong way round; the missed gain sits on the underproduced units before F. And it is an area bounded by D above and MSC below from Q = 5 to Q = 7 — not a distance, not any triangle drawn between salient points.)
5. A subsidy shifts MPC down. Through which point must MPC − subsidy pass to deliver the social optimum?
F. MPC − subsidy must cross D exactly at F: a £4-per-unit subsidy, equal to the spillover benefit, lands it there. Reward the spillover and the market then chooses Q = 7 itself. (Through the old equilibrium E the new curve changes nothing; go further and output overshoots the optimum.)
Now test yourself
Every corner has a letter. Answer with the points and areas, exactly like the exam. Every wrong answer gets a diagnosis — that is the diagram telling you what to fix.