← A Level Economics Revision · Home

The positive consumption externality diagram — A-Level Economics
Play the game and get tested on every point of the diagram — every wrong answer gets a diagnosis. Then study the answers below. Measure what you don’t know, then fix what you don’t know.
The diagram
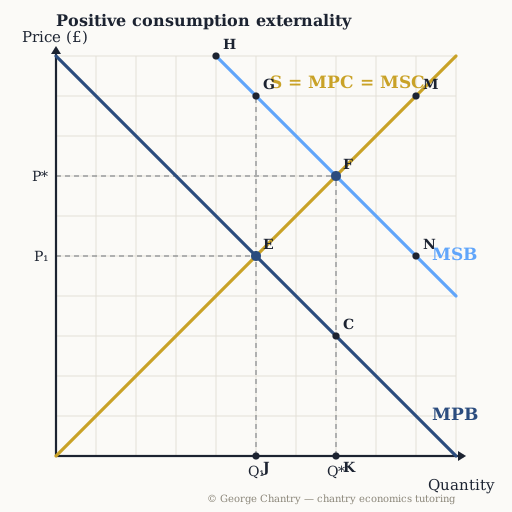
Supply is labelled S = MPC = MSC — the cost side has no spillover here. The benefit side does: MSB is drawn above MPB, and the vertical gap between them is the benefit to other people that the individual buyer ignores. The market settles at E where MPB crosses S (P₁, Q₁ = 5); the social optimum is F where MSB crosses S (P*, Q* = 7).
The game’s questions — with the answers explained on the diagram
These are the exact questions the game asks. Play first if you want the real test — or study them here with the answer for each one.
1. Vaccinations benefit others too: MSB sits above MPB. Which point is the FREE-MARKET outcome?
E. People only weigh their PRIVATE benefit: MPB crosses S at point E, quantity 5 — society wants more. Individuals ignore the benefit to others, so the market settles there: an UNDERconsumption. (Point F is the social optimum the market undershoots; G is the social benefit of the market quantity, not where the market settles.)
2. Which point is the SOCIAL optimum?
F. Where FULL benefit (MSB) meets cost: point F, quantity 7. Count ALL the benefits and MSB crosses S there. This is why governments subsidise vaccines.
3. Which area is the potential WELFARE GAIN society misses at the free-market quantity?
The triangle G E F. Units 5→7 are worth more to society (MSB) than they cost (S) — triangle GEF is unrealised surplus until we get there. Between market (E) and optimum (F), each unit’s MSB exceeds its cost, and the triangle points at the optimum: the gain society leaves on the table. (The classic error is drawing it the wrong way round, past F instead of on the underconsumed units before it.)
4. Which distance shows the MARGINAL EXTERNAL BENEFIT of the last unit the market consumes?
The distance E G. MSB minus MPB at Q = 5: the £4 of benefit to OTHERS from the market’s last jab. MEB is the VERTICAL gap between MSB and MPB at the quantity in question — at the market quantity that is E up to G: £4 of spillover benefit. (Not a stretch of the supply curve, and not the gap between the two equilibria.)
5. A subsidy shifts S down to S − subsidy. Through which point must the NEW curve pass to reach the social optimum?
C. S − subsidy must cross the PRIVATE demand curve MPB at Q = 7 — point C (£3). Consumers decide on MPB, not MSB, so that is where the crossing must land: price falls and demand extends to the optimum. (The A* trap is answering F: F sits on MSB, but consumers buy according to their private benefit, so crossing at F would leave demand short.)
Now test yourself
Every corner has a letter. Answer with the points and areas, exactly like the exam. Every wrong answer gets a diagnosis — that is the diagram telling you what to fix.