← A Level Economics Revision · Home

The perfect competition diagram (short run) — A-Level Economics
Play the game and get tested on every point of the diagram — every wrong answer gets a diagnosis. Then study the answers below. Measure what you don’t know, then fix what you don’t know.
The diagram
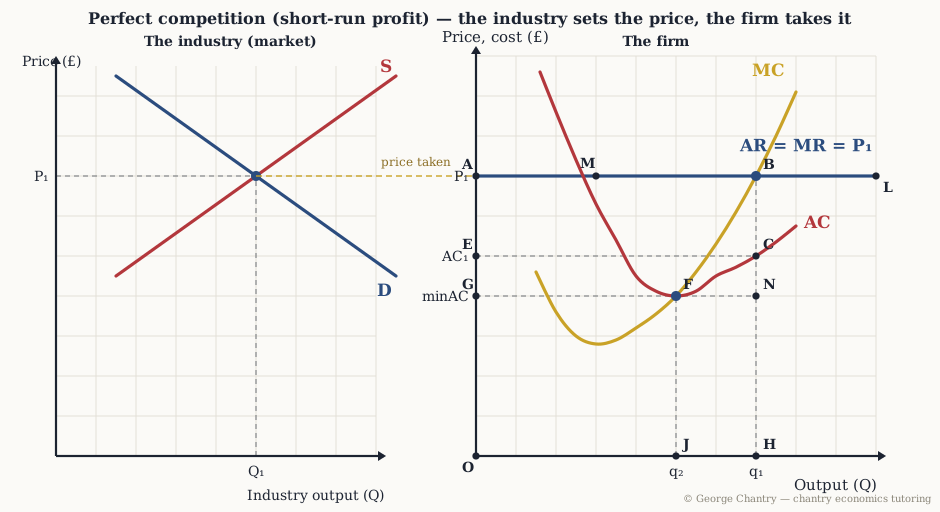
This is the individual firm, not the industry. AR = MR = P₁ is horizontal because the firm is a price taker: it receives the same £7 on every unit, so marginal revenue never changes. It still profit-maximises where MC = MR, at B, output 7. Average cost there is C, so the supernormal profit box is A B C E. Note that MC cuts AC exactly at the bottom of AC, point F — that always has to be true in every diagram you draw — and F is where free entry drives the market in the long run.
The game’s questions — with the answers explained on the diagram
These are the exact questions the game asks. Play first if you want the real test — or study them here with the answer for each one.
1. Why is this firm’s AR = MR curve a horizontal line?
Because the firm is a price taker. There are so many sellers of an identical product that no one firm can move the price. Raise it and consumers switch instantly to a rival; cut it and you sold at less than you could have got. Think of a London taxi driver among thousands: one journey or a hundred, you get the market rate every time. So P = AR = MR, drawn flat — perfectly elastic demand for the individual firm.
2. Which point is the firm’s profit-maximising output in the short run?
B. Profit-max is always MC = MR. Because the firm is a price taker, MR is the flat £7 line, so the rule becomes MC = price — point B, output 7. At a smaller output like M, MC is well below MR, so producing one more unit still adds profit and the firm should expand.
3. Which area is the firm’s supernormal profit?
The rectangle A B C E. (£7 − £5) × 7 units. The trap is dropping the bottom of the box to the minimum of AC instead of to AC at the output actually chosen. Draw AC steep enough that the bottom of the box is obviously different from the minimum of the average cost, and the examiner can see you know the difference.
4. Which point shows productive efficiency — the bottom of the average cost curve?
F. Point F, where MC cuts AC at its lowest point. Every possible economy of scale has been exploited and average cost cannot fall further. MC must pass exactly through the bottom of AC, because average cost stops falling precisely when the cost of one more unit equals the average. Get that crossing wrong and the whole diagram is wrong.
5. There are no barriers to entry. What happens to this profit in the long run?
Entry competes it away until only normal profit is left, at F. Chain it: supernormal profit → no barriers to entry → new firms enter → industry supply shifts right → the market price falls → the flat AR line drops until it is tangential to the bottom of AC at F, where P = AR = MR = min AC. Contrast monopoly, where the whole point is that entry is impossible, so the profit survives.
6. Evaluation: what does perfect competition fail to deliver once profit has been competed away?
Dynamic efficiency. In the long run this model is allocatively and productively efficient — say so, or you lose marks. The evaluation is dynamic efficiency, and it has two prongs worth chaining: there is no supernormal profit left to reinvest, and there is no reward for risk-taking, because any gain is competed away. So no new products and no long-run fall in costs. The counter: fierce competition may force firms to invest anyway, just to survive.
Now test yourself
Every corner has a letter. Answer with the points and areas, exactly like the exam. Every wrong answer gets a diagnosis — that is the diagram telling you what to fix.