← A Level Economics Revision · Home

The negative production externality diagram — A-Level Economics
Play the game and get tested on every point of the diagram — every wrong answer gets a diagnosis. Then study the answers below. Measure what you don’t know, then fix what you don’t know.
The diagram
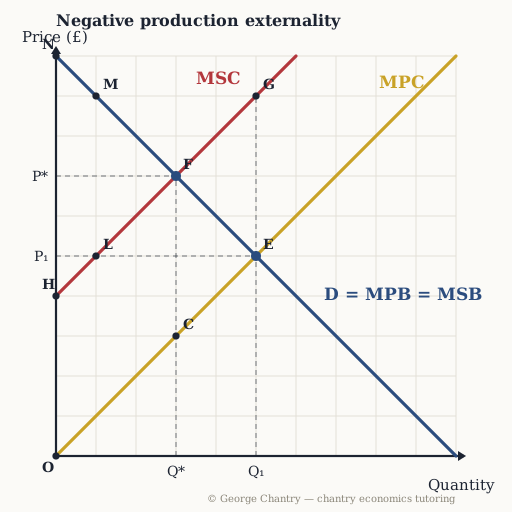
Demand is labelled D = MPB = MSB — the benefit side has no spillover here. The problem is on the cost side: MSC is drawn above MPC, and the vertical gap between them is the pollution the firm does not pay for. The market settles at E where MPC crosses D (P₁, Q₁ = 5); society’s optimum is F where MSC crosses D (P*, Q* = 3).
The game’s questions — with the answers explained on the diagram
These are the exact questions the game asks. Play first if you want the real test — or study them here with the answer for each one.
1. A factory pollutes: MSC sits above MPC. Which point is the FREE-MARKET outcome?
E. Firms only see their PRIVATE costs: MPC crosses D at point E, quantity 5. The market ignores the pollution — firms equate private cost with demand and settle there. (Point F is the social optimum, which the market ignores; G is the social cost of the market output, not where the market settles.)
2. Which point is the SOCIAL optimum, where society would like this market to be?
F. Where the FULL cost (MSC) meets benefit: point F, quantity 3. Society counts ALL costs, so MSC crosses D there. Note it is NOT zero — the first units are worth their full social cost. Some pollution is worth tolerating — but not this much.
3. Which area is the WELFARE LOSS from the market overproducing?
The triangle F G E. Units 3→5 cost society (MSC) more than they’re worth (D) — the wedge FGE is pure loss. Between the optimum (F) and market output (E), every unit’s MSC exceeds its benefit on D; the triangle sits on those overproduced units, pointing at the optimum. (The classic error is drawing the welfare-loss triangle the wrong way round, on the units before F rather than the overproduced ones past it.)
4. Which distance shows the MARGINAL EXTERNAL COST of the LAST unit the free market produces?
The distance E G. MSC minus MPC at Q = 5: the £4 of damage the market’s last unit dumps on third parties. MEC is the VERTICAL gap between MSC and MPC at the quantity in question — at the market output that is E up to G: £4 of harm nobody pays for. (Not a stretch along either curve, and not the gap between the two equilibria.)
5. A corrective tax shifts MPC up to MPC + tax. Through which point must the NEW curve pass to fix the market?
F. MPC + tax must cross D exactly at F, the social optimum — a tax equal to the £4 MEC does it, internalising the externality. The corrective tax makes the polluter pay the damage, so the market chooses Q = 3 on its own. (Through the old equilibrium E the new curve changes nothing; overshoot and output falls below the optimum.)
Now test yourself
Every corner has a letter. Answer with the points and areas, exactly like the exam. Every wrong answer gets a diagnosis — that is the diagram telling you what to fix.