← A Level Economics Revision · Home

The minimum price diagram — A-Level Economics
Play the game and get tested on every point of the diagram — every wrong answer gets a diagnosis. Then study the answers below. Measure what you don’t know, then fix what you don’t know.
The diagram
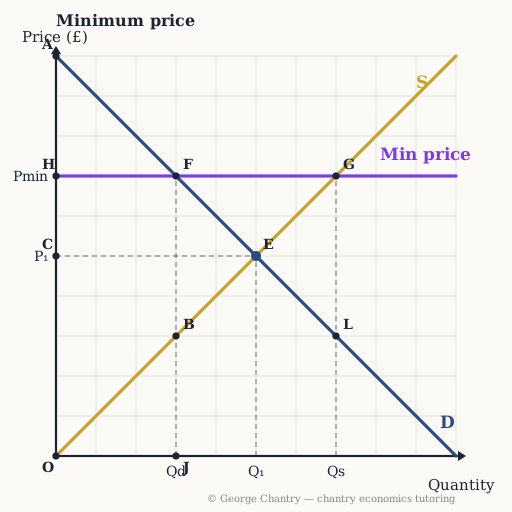
The dashed line is the minimum price, Pmin, set above the free-market equilibrium E (P₁, Q₁). At the floor the supply curve gives Qs (point G) while the demand curve gives only Qd (point F): the horizontal gap between them is the excess supply. Only Qd actually trades — this time demand is the short side.
The game’s questions — with the answers explained on the diagram
These are the exact questions the game asks. Play first if you want the real test — or study them here with the answer for each one.
1. A minimum price of £7 is imposed (think alcohol floor price). Which point shows the quantity actually traded?
F. The short side again — this time demand is short: sellers would love to sell 7 (point G), but buyers only take 3 at £7. Trade is the short side, and here demand is the constraint. (The classic error is answering G, which is quantity supplied.)
2. Which distance shows the excess supply the floor creates?
The distance F G — measured horizontally at the floor price: quantity supplied 7 minus quantity demanded 3 = 4 unsold units. That is why floors created butter mountains and wine lakes.
3. For a minimum price to have any effect it must be set…
Above the equilibrium price. Floors bind from above: they stop price falling to the market-clearing level, leaving unsold excess supply. A floor below the market price is like a fence below your feet — you never touch it.
4. With the floor in place, which area is consumer surplus?
A H F — consumers pay £7 and buy only 3, so surplus is squeezed to that small triangle, much smaller than A C E before. Consumers are the clear losers from a floor, and that squeeze is a key talking point.
5. With the floor in place, which area is producer surplus on the units actually sold?
H F B O — above S, below the £7 floor, out to the 3 units sold. The A* caveat: only on units that sell — the 4 unsold units earn nothing unless the government buys the surplus, as the EU’s Common Agricultural Policy did. That caveat is the evaluation.
6. Which area is the deadweight welfare loss from the floor?
The triangle F E B. Between Q = 3 and Q = 5 willingness to pay (D) exceeds cost (S), but the floor blocks those trades: buyers valued them above cost, so the surplus is destroyed — the triangle points at equilibrium E. (The classic error is drawing it the wrong way round; the lost trades sit before equilibrium, not after.)
Now test yourself
Every corner has a letter. Answer with the points and areas, exactly like the exam. Every wrong answer gets a diagnosis — that is the diagram telling you what to fix.