← A Level Economics Revision · Home

The indirect tax diagram — A-Level Economics
Play the game and get tested on every point of the diagram — every wrong answer gets a diagnosis. Then study the answers below. Measure what you don’t know, then fix what you don’t know.
The diagram
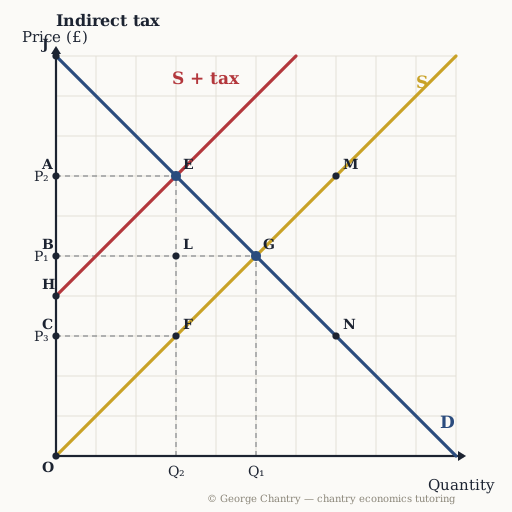
The tax shifts supply left from S to S + tax — the vertical distance between the two supply curves (E down to F) is the tax per unit. The market moves from the old equilibrium G (P₁, Q₁) to the new equilibrium E (P₂, Q₂). The consumer now pays P₂; the producer, after handing the tax to the government, keeps only P₃.
The game’s questions — with the answers explained on the diagram
These are the exact questions the game asks. Play first if you want the real test — or study them here with the answer for each one.
1. A £4-per-unit tax shifts S to S + tax. Which point on the price axis is the price consumers now pay?
A. Where S + tax crosses D (point E), read across to the price axis: consumers pay £2 more, not the full £4 — the tax is split between consumers and producers.
2. Which point on the price axis is the price producers receive per unit, after handing the tax to the government?
C. Consumers hand over £7, the government takes £4, producers keep £3 — read off the original supply curve at point F. The two-prices habit: after any tax or subsidy, always find both prices.
3. Which area is the government’s tax revenue?
The rectangle C F E A — tax per unit × the units still traded, between the two prices. The top half B L E A is the consumers’ burden; the bottom half C F L B is the producers’.
4. Which area is the deadweight welfare loss from the tax?
The triangle E G F. It sits on the units no longer traded and points at the old equilibrium G: surplus shaved off with no gain to anyone — we are never getting that back. (The classic error is drawing the triangle the wrong way round, pointing away from the old equilibrium.)
5. Which area is consumer surplus after the tax?
J A E — below the demand curve, above the price consumers now pay, out to the traded quantity. Shaved down from J G B on both dimensions: part of the old surplus became tax revenue, part died in the welfare loss — that is the story worth telling in an essay.
6. Which area is producer surplus after the tax?
O C F — above the original supply curve, below the £3 producers keep. Down from O B G before the tax: the squeeze that pushes marginal firms toward shutdown.
7. Evaluation: why are indirect taxes criticised as regressive?
They take a larger proportion of income from low-income households than from high-income households. A £4 tax is a bigger slice of a small income — the burden concentrates on those already worse off, and inequality widens.
8. Evaluation: demand for sugar is price inelastic. What does that mean for a sugar tax?
Quantity falls proportionately less than the price rises, so over-consumption largely persists. Necessity, addiction and few substitutes blunt the tax — the same logic applies to alcohol, tobacco and fossil fuels.
9. Evaluation: which unintended consequence could turn the tax into a government failure?
Consumers switch to black-market suppliers who pay no tax — the £2bn UK cigarette black market is the canonical case. Policing costs, lost revenue and dangerous unregulated products follow; if those costs outweigh the benefits, the intervention has made things worse: government failure.
Now test yourself
Every corner has a letter. Answer with the points and areas, exactly like the exam. Every wrong answer gets a diagnosis — that is the diagram telling you what to fix.