← A Level Economics Revision · Home

The supply & demand diagram — A-Level Economics
Play the game and get tested on every point of the diagram — every wrong answer gets a diagnosis. Then study the answers below. Measure what you don’t know, then fix what you don’t know.
The diagram
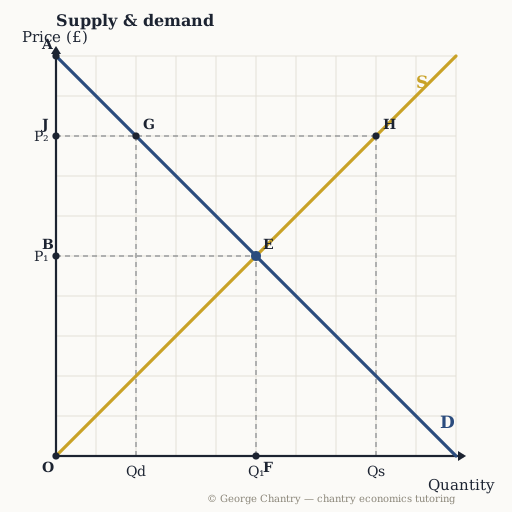
Demand runs down from A on the price axis; supply runs up through the origin O. The two cross at E — price P₁ (£5) at B on the price axis, quantity Q₁ (5) at F on the quantity axis. The higher price line P₂ (£8) sits above that: read across from J to the demand curve at G for the quantity demanded (Qd, 2), and on to the supply curve at H for the quantity supplied (Qs, 8).
The game’s questions — with the answers explained on the diagram
These are the exact questions the game asks. Play first if you want the real test — or study them here with the answer for each one.
1. Which point is the market equilibrium?
E. Where S crosses D — price £5, quantity 5. It is the one price where buyers’ and sellers’ plans match, so there is no pressure for it to change. (The classic errors are picking a point that sits on only one curve — G on demand, H on supply — or picking an intercept like A, which is not an equilibrium at all.)
2. The price is fixed at £8. Which point shows the quantity DEMANDED?
G. At £8, read ACROSS to the demand curve, then down: consumers only want 2. Quantity demanded always lives on the DEMAND curve. (Reading it off the supply curve at H is the classic error; so is stopping at the axis at J, or jumping back to equilibrium at E out of habit.)
3. At the fixed price of £8, this market has…
Excess supply of 6. Qs 8 − Qd 2 = 6 unsold units — the distance G to H. £8 is ABOVE equilibrium, so sellers are keen and buyers are scarce: suppliers offer 8 (point H), consumers take 2 (point G), and those 6 unsold units push the price back down. (Excess demand and excess supply get swapped constantly — check which side of equilibrium the price sits on before you name it.)
Now test yourself
Every corner has a letter. Answer with the points and areas, exactly like the exam. Every wrong answer gets a diagnosis — that is the diagram telling you what to fix.